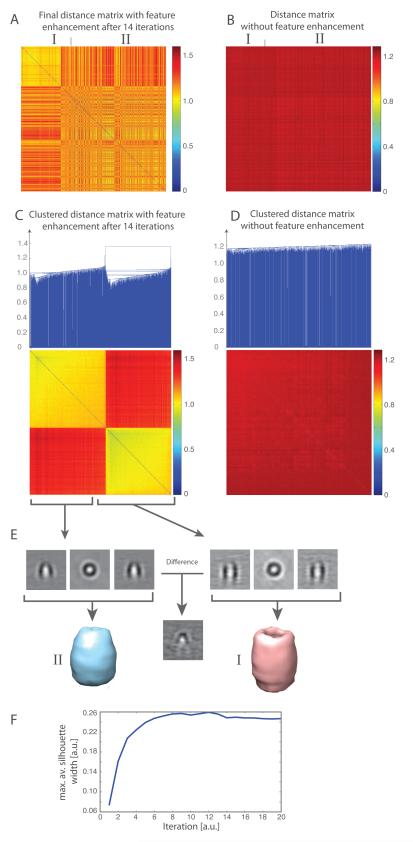
Figure 6.
Reference-free classification of 786 experimental subtomograms, containing GroEL and GroEL/ES complexes. (A) Distance matrix after 14 iterations of reference-free subtomogram classification with the feature enhancement weight . The order of subtomograms is based on the tomogram type. The distance matrix is calculated using the feature enhancement weight. (B) Distance matrix calculated without feature enhancement weight after all subtomograms are aligned to a reference subtomogram. The order of subtomograms is identical to those in panel A. (C) Clustered distance matrix after 14 iterations of the reference-free classification process. Two different clusters are clearly detected by the automatic cutoff detection. (D) Clustering of distance matrix as shown in panel B. The clustering into the two subgroups fails without feature enhancement and reference-free classification. (E) Averaged subtomograms after iterative classification and alignment. (Upper panel) slices through the averaged subtomograms and (lower panel) isosurface of the averaged subtomograms of each cluster. Clearly shown are the distinct features for the GroEL complex (left panel) and the GroEL/ES complex (right panel). A slice through the difference map of both subtomograms shows the distinct differences in both complexes. (F) Convergence of the classification process. The maximal average Silhouette width is calculated from the resulting subtomogram clusters at each iteration of the classification process. The convergence is reached when the maximal average Silhouette width reaches a plateau with increasing iterations.

