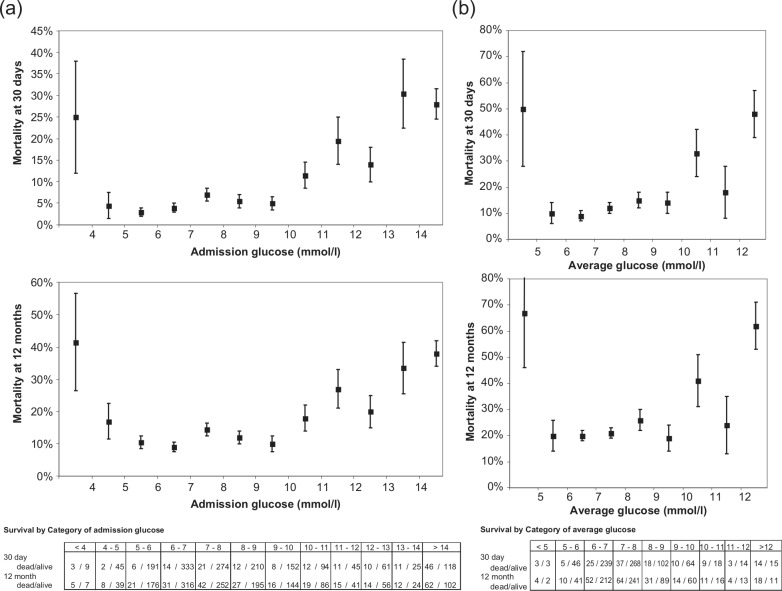
Figure 2.
(a) Mortality at 30 days (top) and 12 months (bottom) by admission glucose. Patients with a glucose <4 mmol/l and >14 mmol/l were grouped into the lowest and highest categories respectively. Error bars represent standard error of the mean. (b) Mortality at 30 days (top) and 12 months (bottom) by average glucose. Patients with a glucose <5 mmol/l and >12 mmol/l were grouped into the lowest and highest categories respectively. Error bars represent standard error of the mean.

