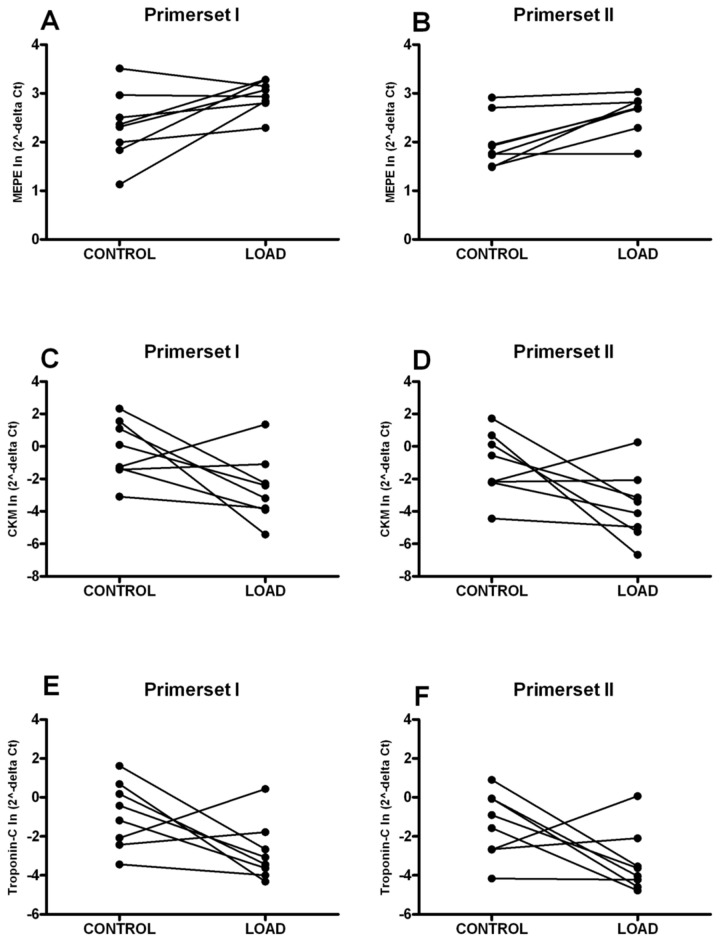
Figure 1. Real-time RT-PCR results of MEPE (A‑B), creatinine kinase (muscle form) (C‑D) and troponin‑C (E‑F) mRNA expression in the loaded tibiae and their contralateral controls represented per rat.
Different markers represent different rats. Lines connect the right and left tibia of the same rat. For each gene, two primers were used, primer set I, which contained a sequence of the oligonucleotide as spotted on the microarray (A, C, E) and primer set II, which contained a fragment of the gene that was not present on the microarray (B, D, F).
a P < 0.05; b 0.05 <P < 0.10;.

