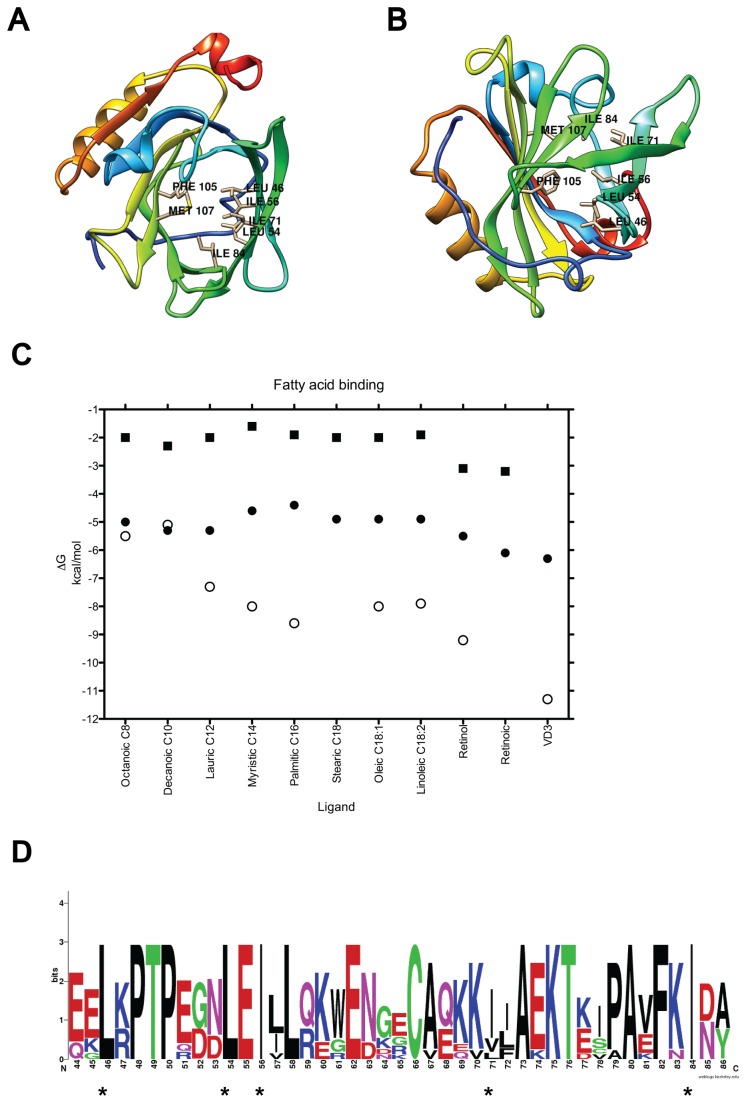
Figure 1. β-lactoglobulin and its calyx binding site.
The main BLG binding site (calyx or Site A) is shown empty from two perspectives: (A) top-down view and (B) bottom-up view. The seven flexible residues required for ligand binding are labeled. The secondary structure is colored from N-terminus in blue, to C-terminus in red. (C) Plot of binding energy calculated from docking vs ligand using rigid, monomeric, empty BLG structures with open (2BLG, black circles), or semi closed (2Q39, black squares) EF loops, and compared to experimentally determined data (open circles). Fatty acids are sorted by increasing size, or in the case of stearic, oleic and linoleic, by decreasing saturation. No experimental affinity has been reported for stearic or retinoic acids. (D) Weblogo of the sequence alignment of BLG from 7 mammals. Asterisks indicate the 5 residues made flexible for docking.

