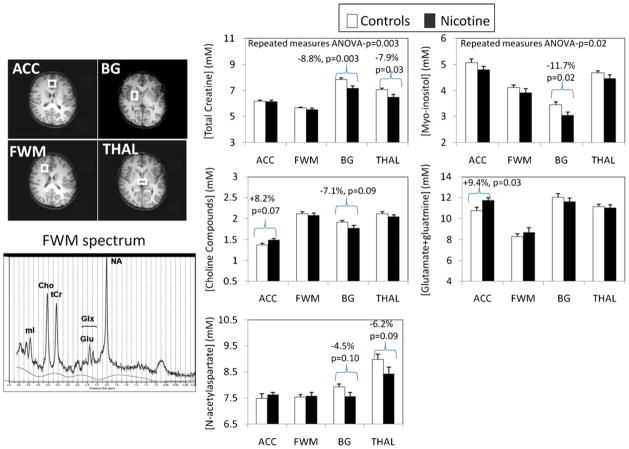
Fig. 1.
Top left: axial MR images showing the placement of the four voxels: (1) anterior cingulate cortex (ACC), which contains primarily gray matter at the anterior and medial portions of both cingulate cortices across both hemispheres and above the anterior portion of the head of caudate; (2) frontal white matter (FWM), which is confined to white matter in the right frontal lobe at the same level as the ACC; (3) right basal ganglia (BG), which contains the central portions of the putamen, the globus pallidus, and some portion of the body of the caudate; and (4) thalamus (THAL), which is confined to the gray matter structure and spans across both hemispheres, posterior to the BG voxel. Bottom left: representative MR spectrum from the frontal white matter, showing well-defined peaks for each of the brain metabolites measured (NA N-acetylaspartate, GLX glutamate+glutamine, tCr total creatine, CHO choline-containing compounds, MI myo-inositol). The solid line shows the fitted spectrum from LCModel. Right panel: brain metabolite concentrations in the four brain regions (also see Table 2) are shown for each of the metabolites of interest. The brackets indicate metabolite values that are significantly different, or show a trend for significance, between the two groups. Lower tCr and MI, and to a lesser extent CHO and NA, are found in the basal ganglia of the PNE children compared to the unexposed controls. Total creatine and trends for NA are also lower in the THAL. However, in the anterior cingulate cortex region, GLX and to a lesser extent CHO are elevated in the PNE children relative to the controls

