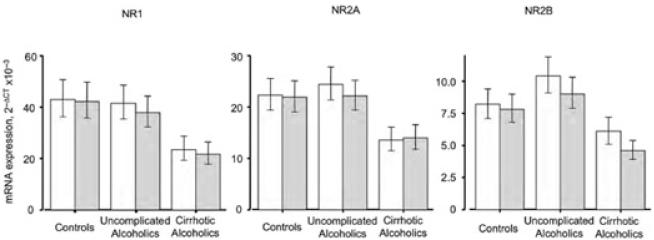
Figure 4.
Relative subunit mRNA expression in frontal and motor cortex. SFC: open columns; PMC: shaded columns. The main effect for group was significant, F2,56 = 4.824, P = 0.012; post hoc Newman–Keuls testing showed that overall mean subunit mRNA expression in cirrhotic alcoholics differed from that in both controls (P = 0.0087) and non-cirrhotic alcoholics (P = 0.011), who did not differ from each other. For the individual transcripts averaged across the two areas, Newman–Keuls tests showed that values in cirrhotic alcoholics differed from those in controls (NR1: P = 0.012; NR2A: P = 0.021; NR2B, P = 0.041); from those in non-cirrhotic alcoholics (NR1: P = 0.018; NR2A, P = 0.054; = NR2B, P = 0.041); and from values averaged across controls and non–co-morbid alcoholics (NR1: P = 0.0057; NR2A, P = 0.025; NR2B, P = 0.0078). In no instance did controls differ from alcoholics without co-morbid disease on these tests. For NR2B transcripts in cirrhotic alcoholics, SFC expression differed from that in the PMC, P = 0.025 by Newman–Keuls test; no other regional difference was significant for any transcript in any group. Mean ΔCT values were converted to 2−CT values for presentation; error bars represent SEM.

