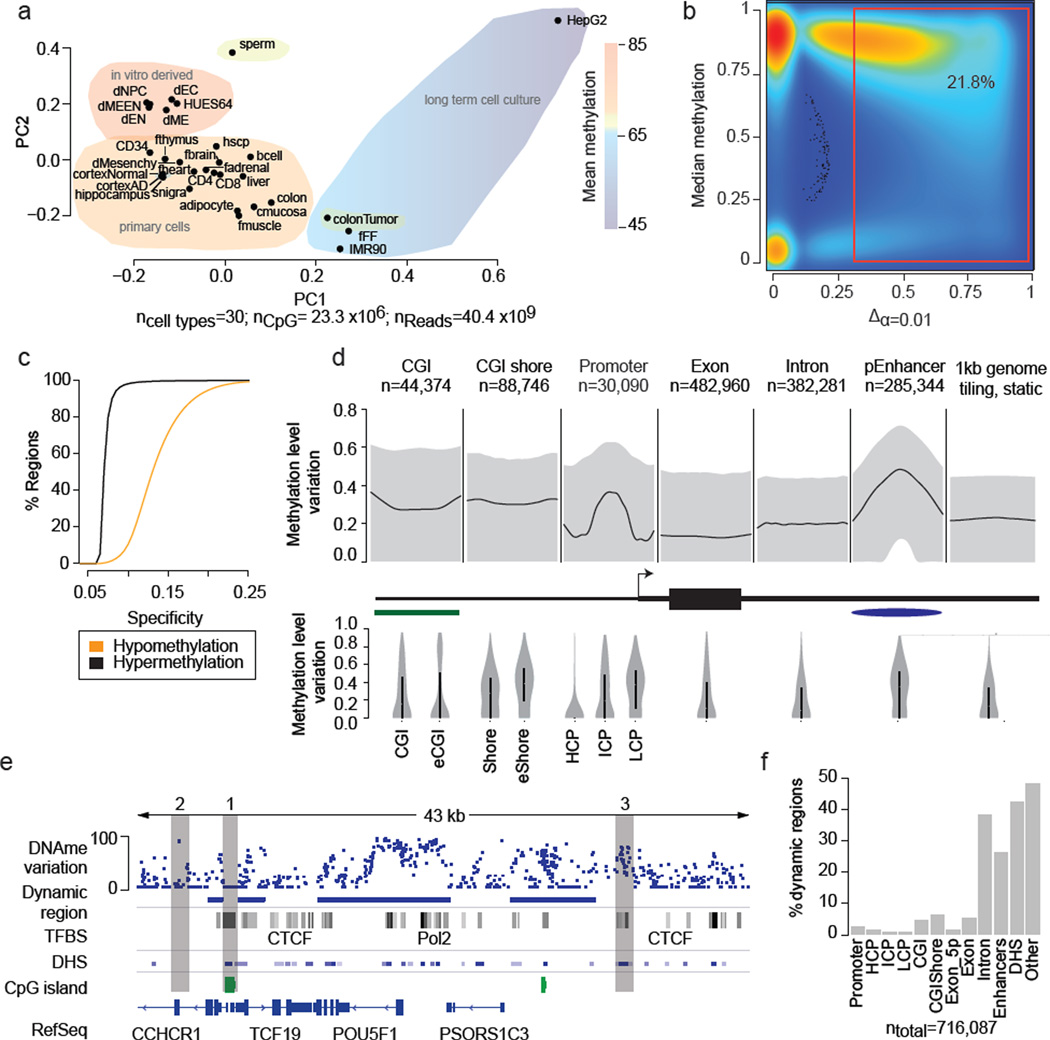
Figure 1. Identification and characteristics of differentially methylated regions (DMRs) in the human genome.
a. Principal component analysis based on CpG methylation levels for 1kb tiles across 30 diverse human cell and tissue samples. Coloring indicates classification of samples into subgroups and group wise mean DNAme. Detailed sample annotations are listed in Supplementary Table 1. Gray area indicates Alzheimer’s disease (AD) samples..
b. Density scatterplot of CpG wise DNAme level differences (x-axis, p≤0.01) and CpG median methylation (y-axis) across the 24 developmental samples (excluding cancer and long-term culture). Coloring indicates CpG density from low (blue) to high (red). The red box highlights dynamic CpGs (≥0.3).
c. Cumulative distribution of DMR specificity. High hypo/hypermethylation specificity indicates that particular region is methylated/unmethylated in most tissues and deviates from this default state in only one or few cases.
d. Top: Composite plot of mean DNAme differences across various genomic features. Black line indicates the median of the average DNAme difference across each feature. Grey areas mark 25th and 75th percentile. Bottom: Distribution of mean DNAme difference for each genomic feature. Black bar indicates 25th and 75th percentile while white dot marks the median. For CGI islands, a smaller, experimentally determined set (eCGI; n=25,490) is shown as well. Promoters are broken down into high CpG content (HCP, n=24,899), intermediate CpG content (ICP, n=10,920) and low CpG content (LCP, n=7,946) regions (n=43,765 total).
e. Methylation level variation across the OCT4 locus (chr6:31,119,000–31,162,000) (top). Blue boxes indicate DMRs significant at p≤0.01 and exhibit a minimum difference ≥0.3 across the 24 developmental samples. For reference, ENCODE TFBS cluster track, DNAse I hypersensitive sites, CpG islands and RefSeq genes are shown.
f. Distribution of DMRs across various genomic features. Each region is assigned only to one of these genomic feature according the ranking promoter, CGI, CGI shore, exon, intron, putative enhancers, DNAse I hypersensitive site or other.

