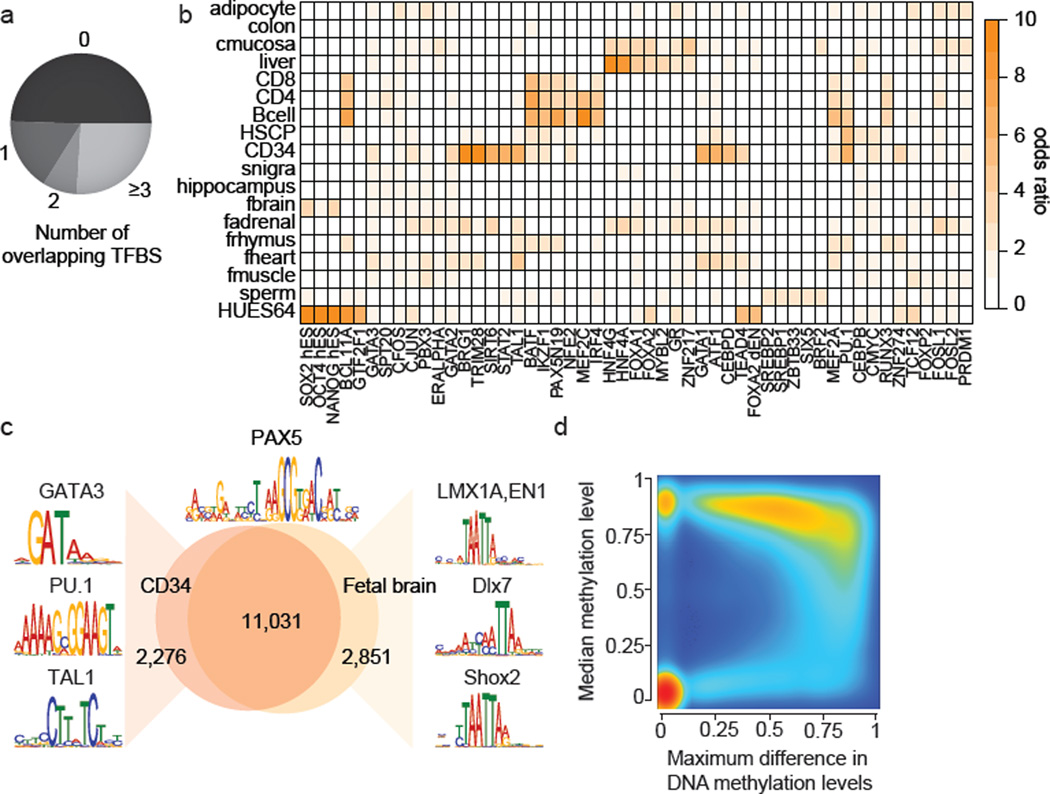
Figure 2. Dynamic CpG methylation regions frequently co-localize with transcription factor binding sites (TFBS).
a. Overlap of DMRs with ENCODE TFBS.
b. Enrichment of the top four TFBSs significantly overrepresented (p<0.01, empirical test) in DMRs specific to the cell type indicated (specificity >0.15). Color code quantifies median enrichment odds ratio compared to size matched random control regions.
c. Overlap of PAX5 motifs (±100bp top) unmethylated in CD34 cells or fetal brain across the entire human genome. Regions specifically unmethylated in CD34 or fetal brain were subjected to motif analysis and top differentially co-occurring motifs are highlighted on the left for CD34 and on the right for fetal brain.
d. Density scatterplot of maximum DNAme difference across 24 developmental samples for TFBS cluster track (n=2.7 million) and median methylation level across all samples. Color code indicates density of TFBS from low (blue) to high (red)..

