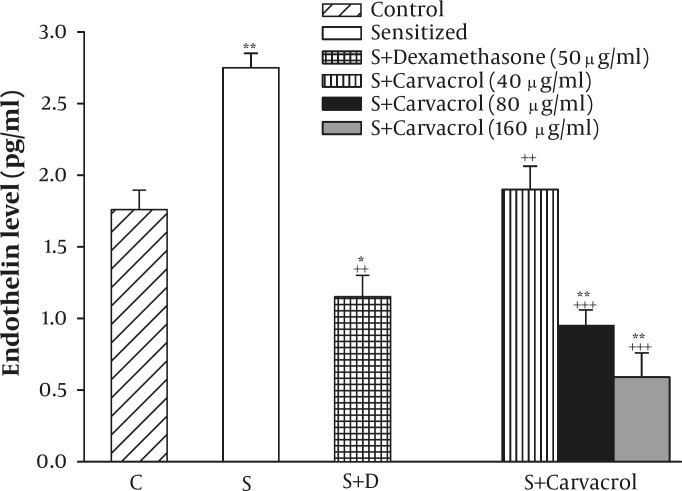
Figure 3.
The levels of serum endothelin in control (C), sensitized (S), S treated with dexamethasone and three concentrations of carvacrol guinea pigs (for each group, n=6). Statistical differences between the control and other groups: **; P<0.01, ***; P<0.001. Statistical differences between treated animals vs sensitized group: ++: P<0.01, +++: P<0.001, +++: P<0.001

