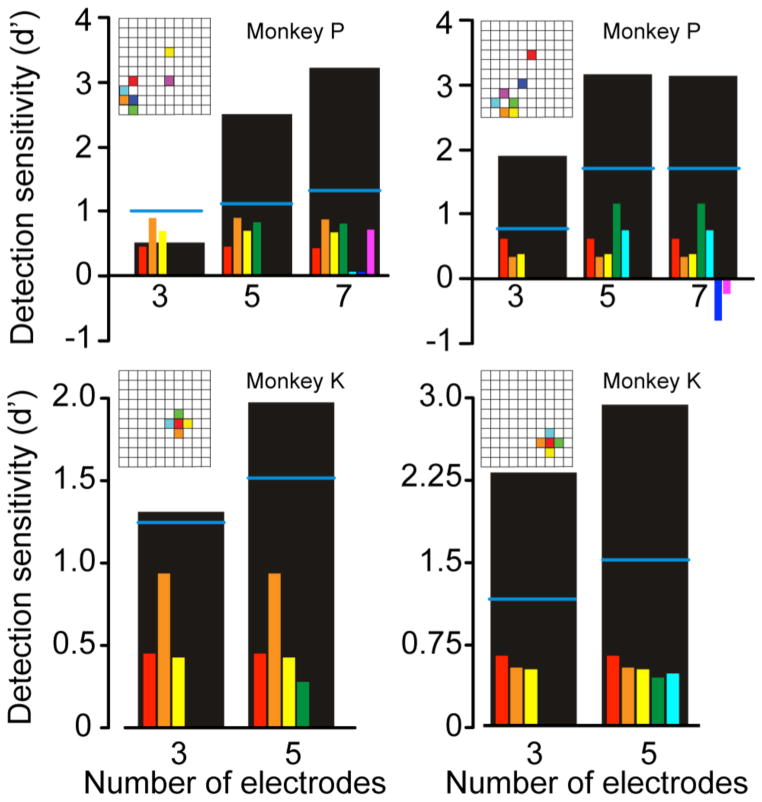
Figure 4.
Increased detection sensitivity Δd′ with multi-electrode stimulation in four different sessions. The small colored bars in each panel indicate the d′ score for each individual electrode when stimulated with a subliminal current. Horizontal blue lines indicate the theoretical score under combined stimulation, d′c, computed under the independence assumption as per Eq. 8. Large black bars indicate the actual effect of simultaneous stimulation, which exceeded d′c in 9 out of 10 cases. Insets indicate the location of individual electrodes.

