
Figure 3.
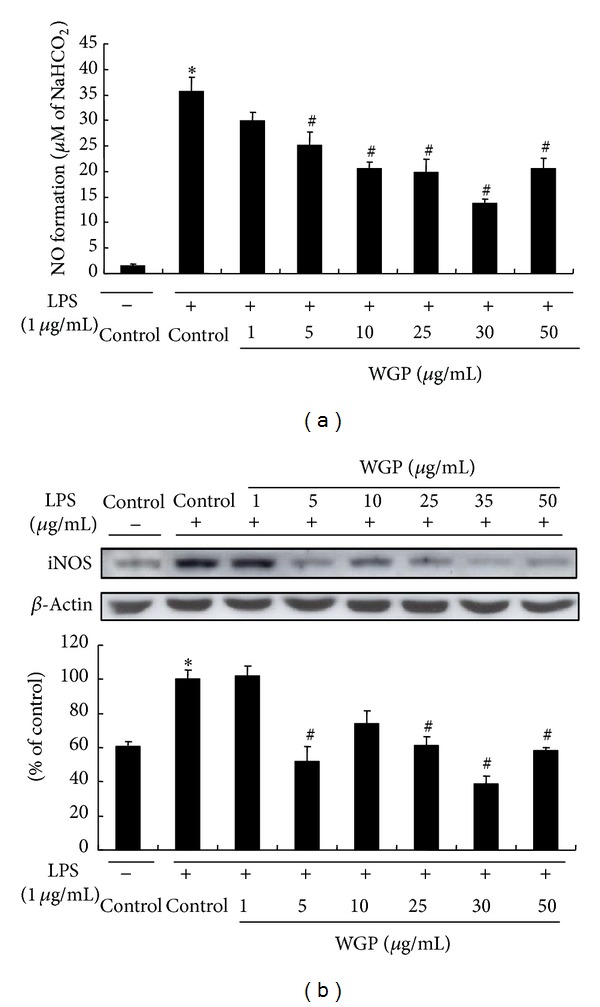
Effects of WGP on LPS-induced NO and iNOS protein expression in RAW 264.7 cells. (a) NO formation. The cells were treated with LPS only or with WGP ranging from 1 to 50 μg/mL for 24 h. The culture media were collected, and the nitric oxide concentration was measured by the Griess reaction. Each value represents mean ± S.D. of triplicate experiments. (b) The cells were treated with WGP ranging from 1 to 50 μg/mL for 1 h and then treated with LPS for 24 h. Equal amounts of total protein were subjected to Western blot analysis as described in Section 2. The ratio of immunointensity between the iNOS and the β-actin was calculated. The bar represents means ± S.D. from three independent experiments. *P < 0.05 indicates differences from the unstimulated control group. # P < 0.05 indicates differences from the LPS-treated group.