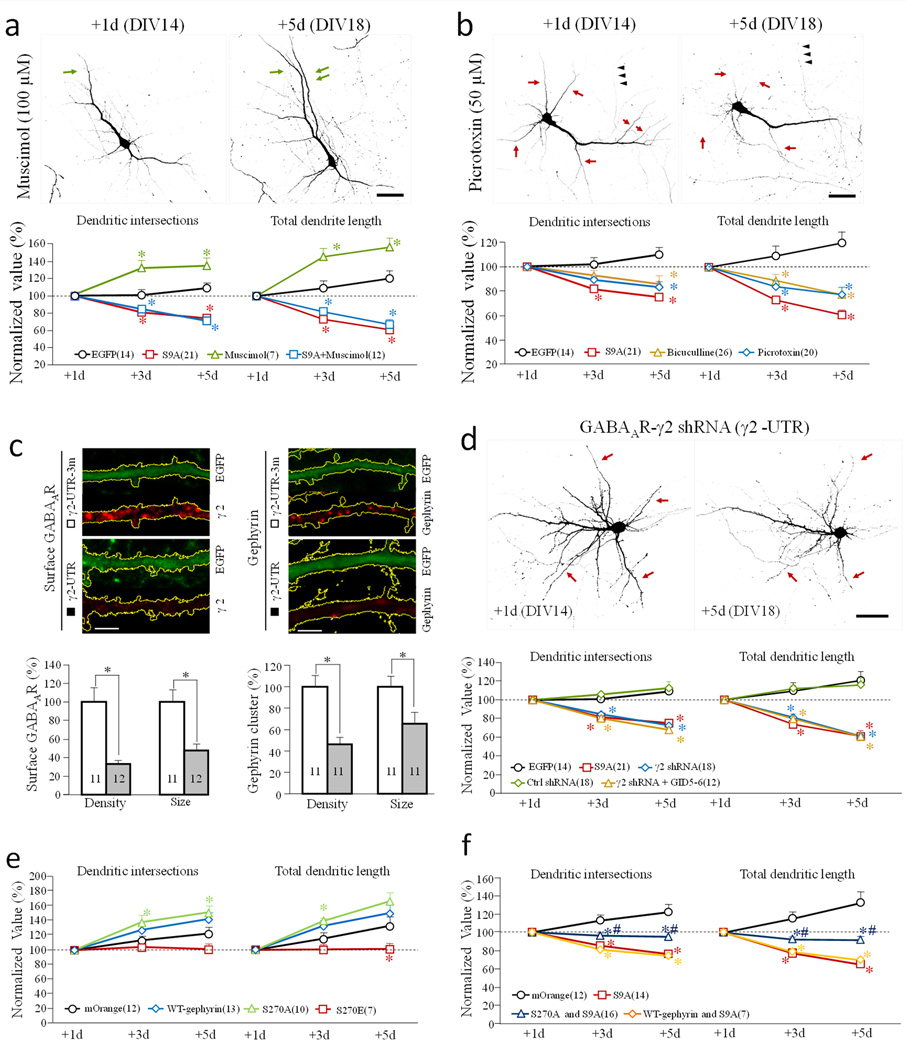
Figure 8.
Effects of GABAAR manipulations on dendritic development. (a–b) Effects of GABAAR agonist and antagonist on dendrites. Hippocampal neurons were transfected on DIV 13, and treated with either Muscimol (GABAAR agonist) (a) or Picrotoxin and bicuculline (GABAAR antagonists) (b) after initial imaging on DIV 14 (+1d). Representative images of EGFP-expressing neurons are shown on the top. Green and red arrows indicate the growth and shrinkage of dendritic branches, respectively. Normalized number of dendritic intersections and total length are shown at the bottom. Scale bars = 50 µm. * p<0.05 comparing to the corresponding point of EGFP-expressing cells (Student’s t-test). (c–d) Effects of GABAAR knockdown on dendrite development. (c) Neurons transfected with shRNAs were identified by EGFP fluorescence. Representative confocal images of EGFP fluorescence and immunofluorescence (of GABAAR or gephyrin) are shown on top. Scale bars = 5 µm. The bar graphs show the cluster size and density of surface GABAAR (left) and cytoplasmic gephyrin (right) in cells expressing the shRNA (r2-UTR) or the control shRNA (r2-UTR-3m). * p<0.01, Student’s t-test. (d) GABAAR knockdown results in dendritic shrinkage. Representative images of EGFP-expressing neurons are shown at the top. Scale bar = 50 µm. Normalized number of dendritic intersections and total length are shown at the bottom. For each group, all data are normalized to the +1 day. * p<0.05 comparing to the corresponding point of the control (EGFP, Student’s t-test). (e–f) Effects of coexpression of wild-type-gephyrin, S270A-gephyrin and S270E-gephyrin, without (e) or with (f) GSK3β-S9A on dendrites. The line graphs show the number of dendritic intersections and total dendritic length. * p<0.05 comparing to the corresponding point of the mOrange group (Student’s t-test). #p<0.05 comparing to the corresponding point of GSK3β-S9A group (Student’s t-test). The data are normalized to +1d. Numbers in brackets indicate the number of cells examined for each group (from at least three independent batches of culture). Error bars: SEM.

