
Figure 2. Time-Lapse TFM Reveals Two States of Traction in Individual FA: Stable and Fluctuating.
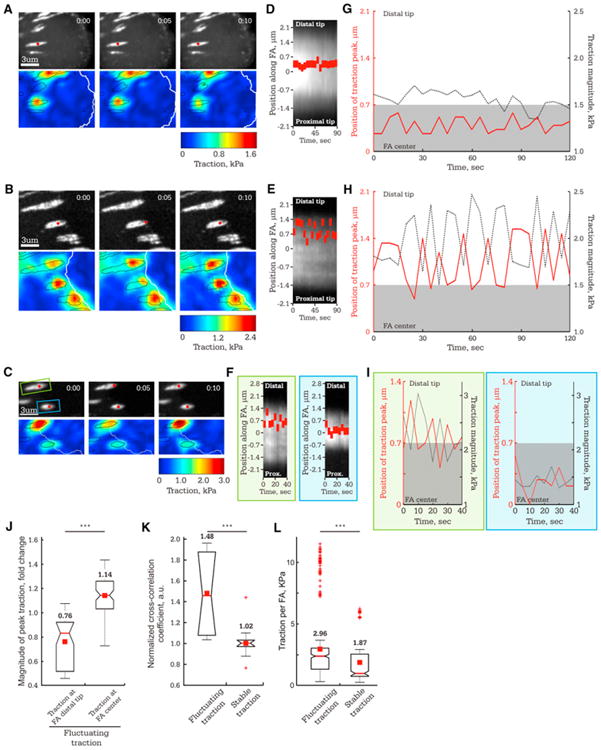
Images of FAs in MEF (8.6 kPa ECM) were captured at 5 s intervals.
(A–C) Images of eGFP-paxillin (top panels, time in min:s shown) and corresponding heatmaps of reconstructed traction stresses with FAs outlined in black (bottom panels). Red dot: position of peak traction for the FAs analyzed in (D)–(I).
(A, D, and G) FA in which the position of peak traction remains stable near the FA center.
(B, E, and H) FA in which the position of peak traction fluctuates in the distal half of the FA.
(C, F, and I) Neighboring FAs in which position of peak traction is stable (blue box) or fluctuating (green box).
(D–F) Kymographs along the FAs marked by red dots in (A), (B), and (C), respectively. Red rectangle: Position of peak traction along the FA (y axis) over time(x axis).
(G–I) Plot of the position of peak traction stress along the FA (left axis, red, with the FA center set to zero) and the peak traction magnitude (right axis, black) over time for the FAs marked in (A), (B), and (C), respectively. Grey rectangle highlights values that are not significantly different from the FA center.
For (J)–(L), TFM time series of individual FAs were classified according to whether the FA exhibited fluctuating or stable traction, with means shown above each plot.
(J) Box plot of peak traction stress from the frames of TFM image series when the position of the traction peak was either in the distal tip of the FA (>0.7 μm from the FA center, n = 274 TFM frames) or at the FA center (<0.7 μm from the FA center, n = 28 TFM frames) for FAs that exhibited fluctuating traction (n = 9 FAs). Values are normalized to the mean of peak traction stress for the entire TFM series of each FA. (K) Box plots of cross-correlation coefficient between the magnitude and location of peak traction for FAs exhibiting fluctuating (n = 9 FAs) or stable traction (n = 9 FAs).
(L) Box plot of mean integrated traction stress per FA for each TFM frame in time-lapse series of FAs that exhibited either fluctuating (n = 302 frames, 9 FAs) or stable (n = 285 frames, 9 FAs) traction.
See also Figure S2 and Movies S1 and S2.