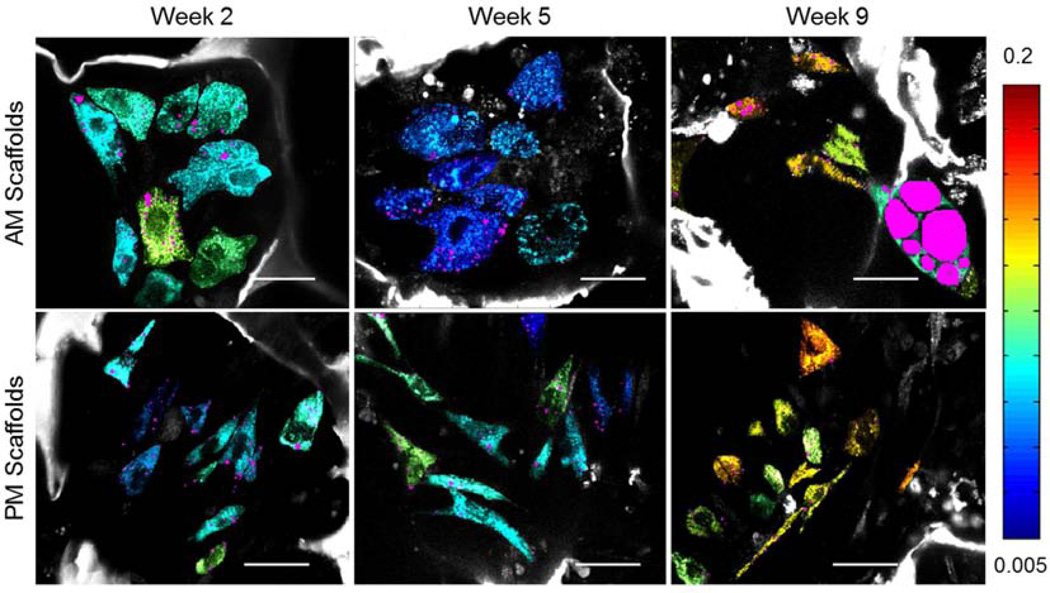
Figure 6.
Dynamic changes in redox ratio and lipid content in 3D silk scaffolds embedded with hMSCs and treated with either adipogenic (blue) or propagation (red) media. Mean a) redox ratio per cell b) cell volume (pixels) c) Lipid volume per cell d) lipid to cell volume ratio e) lipid droplet number per cell and f) droplet size per cell. Error bars represent standard errors of the mean. Significant differences noted in graphs are evaluated at p<0.05.

