
Fig. 1.
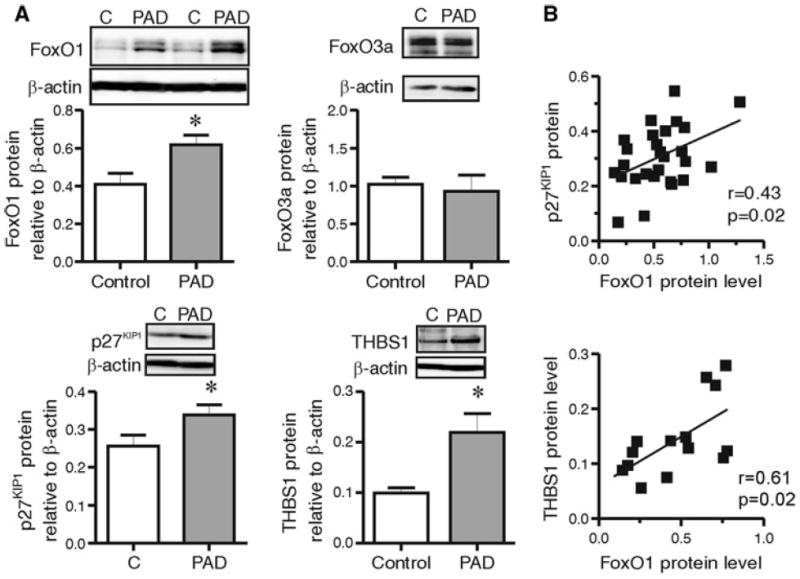
FoxO1, but not FoxO3a, protein level increases in response to PAD and is associated with enhanced p27KIP1 and THBS1 protein expression. Gastrocnemius muscles from control and PAD subjects were assessed by Western blot a for FoxO1 and FoxO3a, p27KIP1 and THBS1 protein levels, and quantified relative to β-actin. Data are mean ± SEM; * indicates significant differences: p = 0.01 for FoxO1; p = 0.047 for p27KIP1; p = 0.01 for THBS1 (Unpaired two tailed Student’s t tests, n = 8–13 per group). b FoxO1 relative protein levels were compared with protein levels of p27KIP1 (top; N = 26) and THBS1 (bottom; N = 16). The Pearson’s correlation coefficient (r) was calculated to assess the relationships between FoxO protein levels and each of the specified parameters