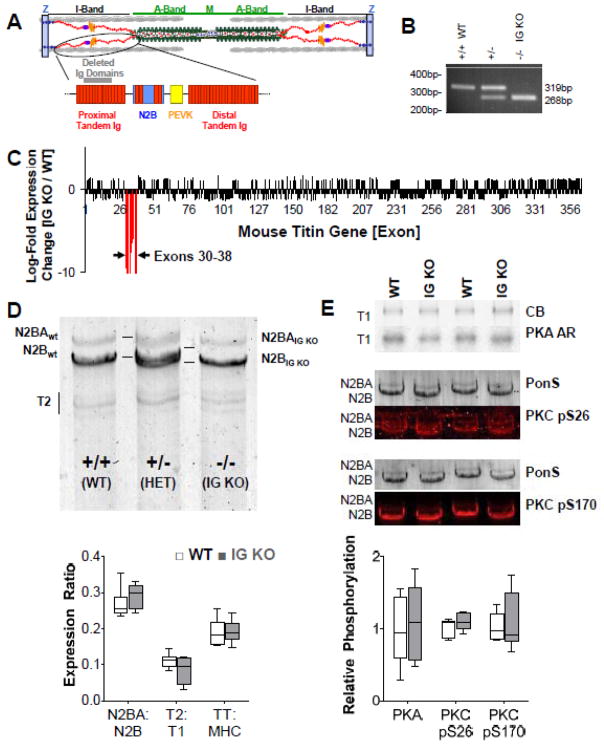
Figure 1.
Basic characterization of the IG KO mouse model. A) Location of Ig 3-11 (deleted in the IG KO) in the spring region of titin (Ig domains are indicated by the rectangular red structures). B) PCR products showing differential gene expression from WT, heterozygous and homozygous IG KO mice. C) Titin exon microarray analysis shows titin exon expression changes only in the 9 deleted exons. D) Titin protein analysis (1% agarose gel). Top: the shortened titin (IG KO) has a higher mobility when compared to the WT titin bands and a doublet can be seen in the HET mice. Bottom: Quantitative analysis shows that titin isoform expression is unchanged (n=6). E) Titin phosphorylation is unchanged in the IG KO. Top: PKA back-phosphorylation and phospho-specific pS26 and pS170 antibodies to PKC Western blotting examples. Bottom: quantification showing unchanged phosphorylation levels in the IG KO (n=4). CB: coomassie blue; AR: autoradiography; PonS: Ponceau S; box denotes 25th and 75th percentile and whiskers display min and max. See Supplemental Figure S7 for dot plots.

