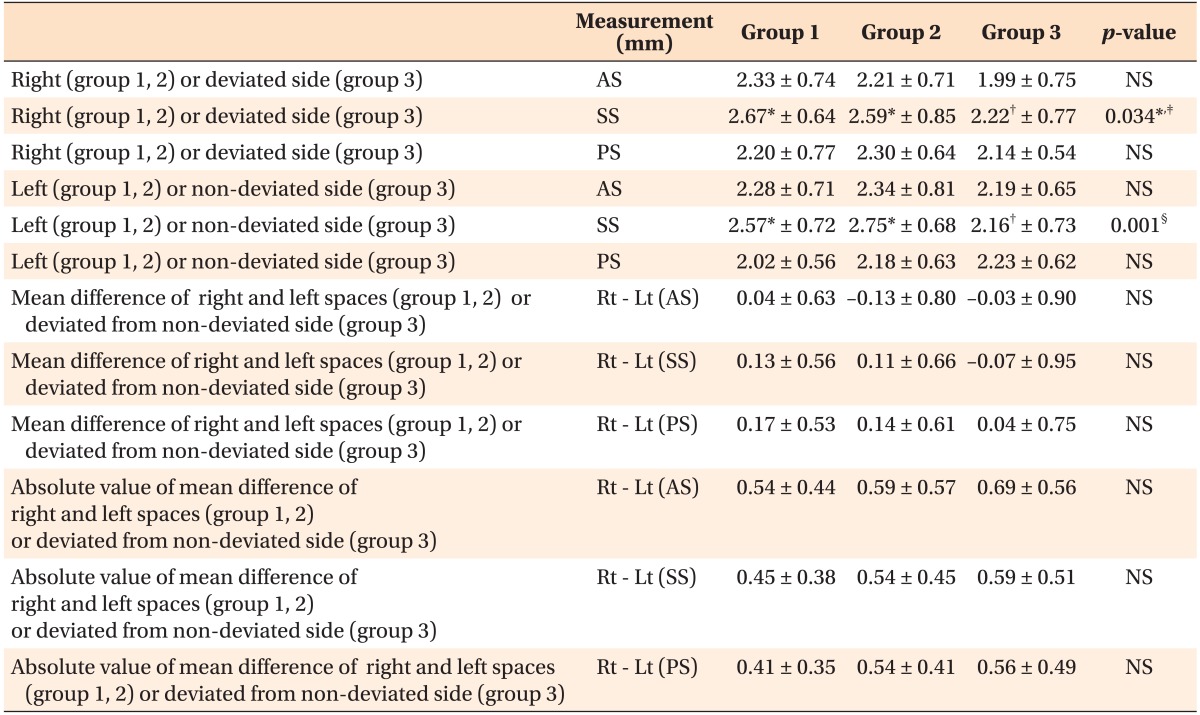
Table 3.
Measurement of the joint space in the sagittal view

Values are presented as mean ± standard deviaton.
Group 1, Normal occlusion; group 2, symmetric class III; group 3, asymmetric class III.
AS, Anterior joint space; SS, superior joint space; PS, posterior joint space; Rt, right; Lt, left; NS, not significant.
Groups with different marks (*, †) are significantly different from each other; ‡p = 0.05; §p = 0.01 (one-way analysis of variance, Scheffé test, and Kruskal Wallis test).
