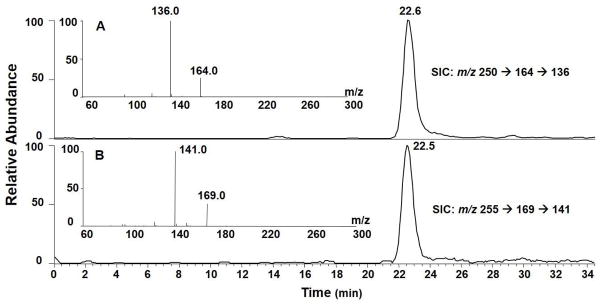
Figure 1.

Selected-ion chromatograms (SICs) for monitoring the m/z 250→164→136 [A, for unlabeled (5′S)-cdA] and m/z 255→169→141 [B, for uniformly 15N-labeled (5′S)-cdA] transitions in the Cu(II)/H2O2/ascorbate-treated calf thymus DNA after enzymatic digestion. Shown in the insets are the positive-ion MS3 spectra for the unlabeled and labeled (5′S)-cdA. The sample was treated under Conditions B listed in Table 1.
