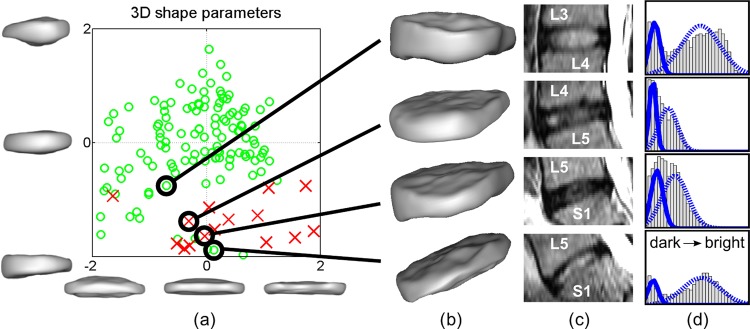
Figure 4.

Projection of dataset 1 onto the first two modes of variation (±2 SD) is shown in (A). Most of the abnormal discs (red crosses) are located in the bottom right area, describing IVD narrowing (as can be seen in figure 3). Four individual example IVD automatic segmentations are shown in (B), corresponding MRI in panel (C) and the corresponding histograms with fitted distributions in (D). A progressive IVD space narrowing can be observed in (B) from top to bottom, which is reflected by the spatial relationship of the corresponding points in (A). The nucleus pulposus signal intensity is lower in the middle two IVD, as seen in (C), resulting in a compressed ‘single’ intensity peak in the histograms (D) demonstrating two close and overlapping Gaussian distributions. IVD, intervertebral disc; 3D, three dimensional. Access the article online to view this figure in colour.
