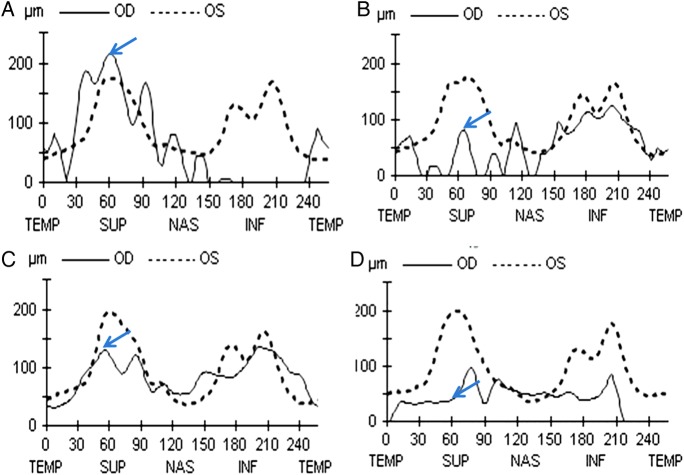
Figure 3.
Retinal nerve fibre layer (RNFL) thickness profiles of both eyes noted on days 3 (A), 7 (B), 30 (C) and 90 (D) showing TSNIT values. Blue arrows show sample 60 values that is the RNFL thickness in the superior quadrant. RNFL profile precisely highlights initial rise due to retinal oedema on day 3 followed by marked decrease on day 7 suggestive of acute reperfusion injury. (C) Return to nearly normal values on day 30 signifying return of circulation and wash out of reperfusion stress mediators. Marked decrease in the value of average retinal nerve fibre thickness can be noted by day 90 due to setting in of atrophy.

