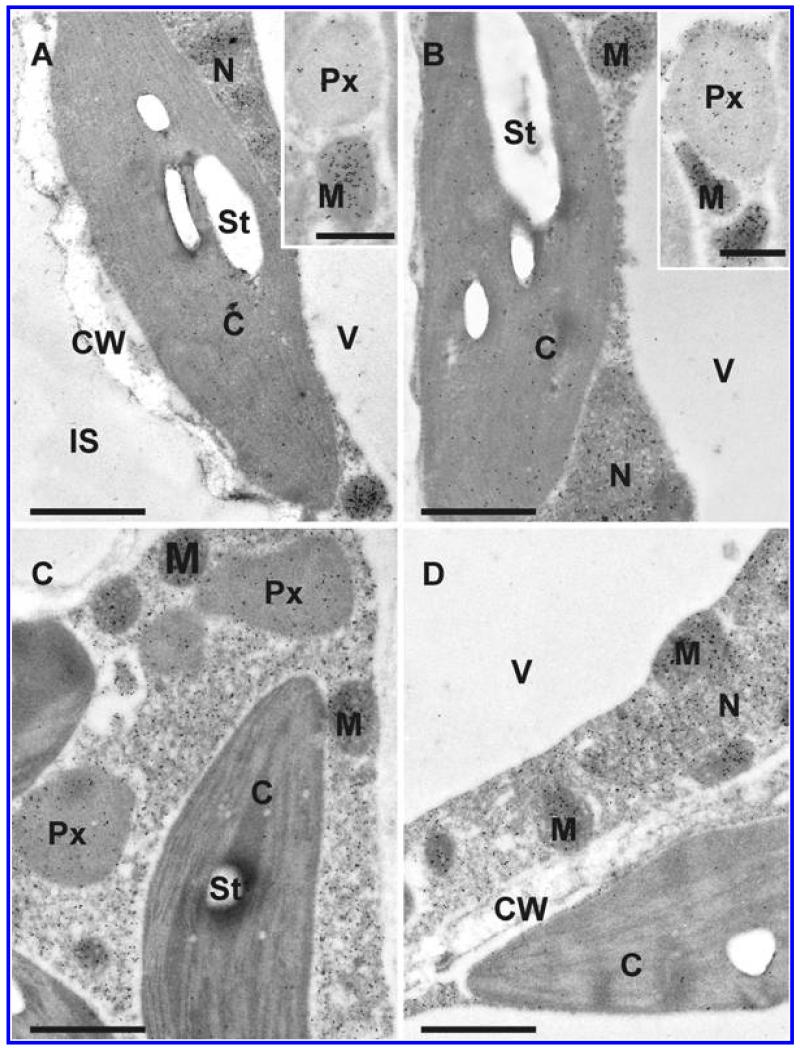
Fig. 7.
Transmission electron micrographs showing the subcellular distribution of glutathione in Arabidopsis thaliana Col-0 leaf cells inoculated with the avirulent strain Pseudomonas syringae pv. tomato DC3000 AvrRpm1 at the day of inoculation (A), 12 h postinoculation (hpi) (B), 24 hpi (C), and 48 hpi (D). C = chloroplasts with or without starch (St), CW = cell walls, IS = intercellular space, M = mitochondria, N = nuclei, Px = peroxisomes, and V = vacuoles. Bars = 1 and 0.5 μm in insets.

