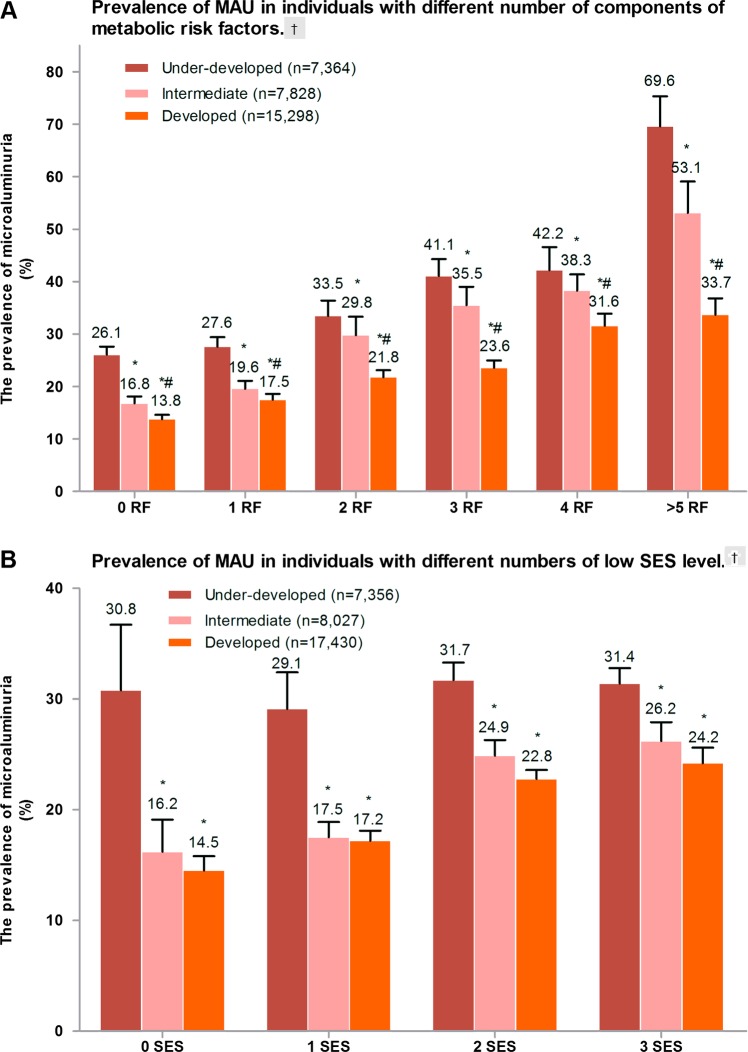
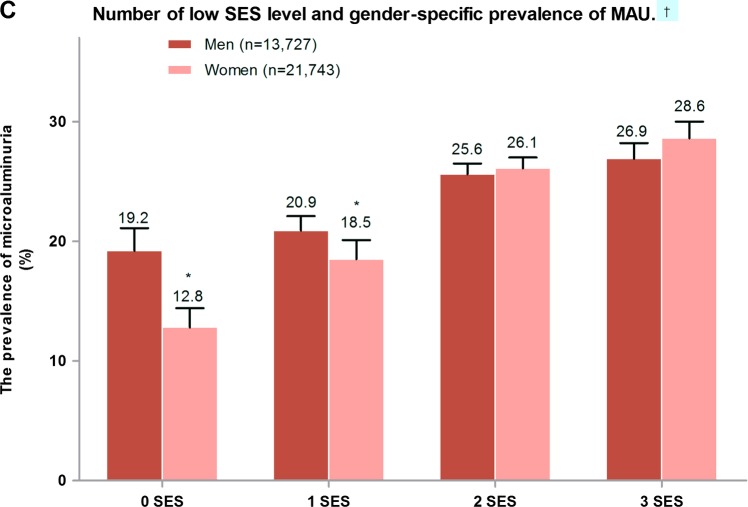
Figure 2.
Prevalence of microalbuminuria (MAU) in individuals with different metabolic status and socioeconomic status (SES) level. (A) Prevalence of MAU in individuals with different numbers of components of metabolic risk factors. †p Trend<0.001 for comparing different risk factor numbers; *p<0.05 vs under-developed area; #p<0.05 vs intermediate developing area. (B) Prevalence of MAU in individuals with different numbers of low-SES level. †p Trend<0.001 for comparing different low SES numbers; *p<0.05 vs under-developed area. (C) Number of low-SES level and gender-specific prevalence of MAU. †p Trend <0.001 for comparing different low-SES numbers;*p<0.01 men vs women.


