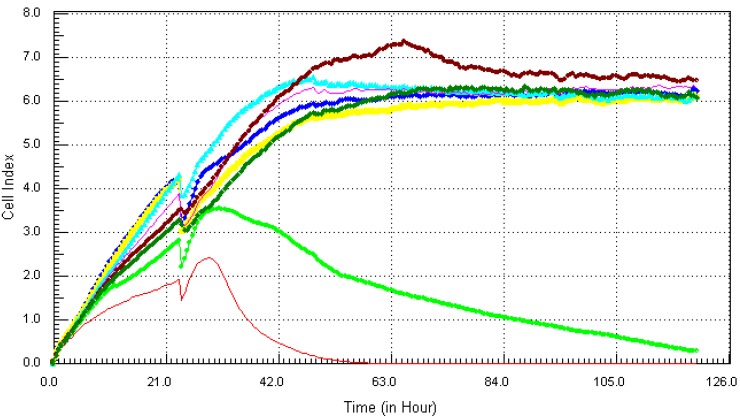
Figure 6.
Kinetics of cytotoxic responses for cadmium in LBSO-treated MCF7 cells monitored by the RT-CES system. 10,000 cells/well were plated in 16-well strips for the RT-CES cytotoxicity assay. Different compound concentrations in µg/mL are indicated by different colors. Red = 21.7, light green = 10.8, blue = 5.4, yellow = 2.7, turquoise = 1.3, pink = 0.68, burgundy = 0.34, green = control.

