Figure 1.

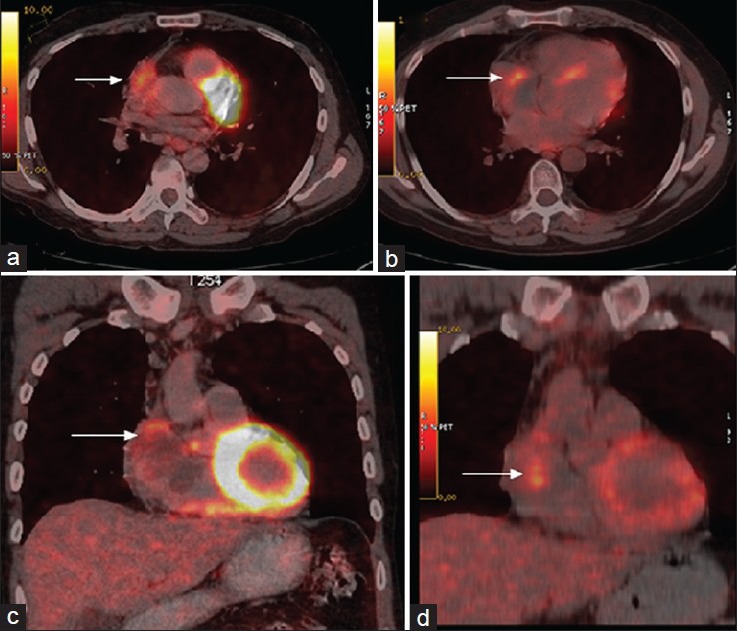
F-18 fluorodeoxyglucose (FDG) positron emission tomography/computed tomography transaxial and coronal pre-treatment slices (a and c) showing FDG uptake in right atrial wall with extension into the pericardium and post-treatment images (b and d) showing significant residual FDG uptake in right atrial wall
