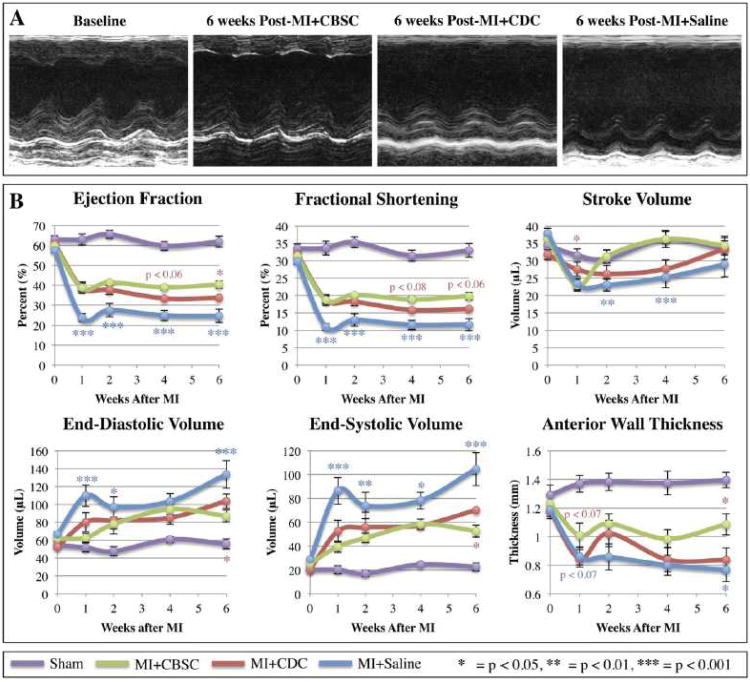
Figure 3. Cardiac function measured by echocardiography.
Animals underwent sham, MI+Saline, MI+CBSC or MI+CDC surgeries and received follow-up serial echocardiography at 1, 2, 4 and 6 weeks post-MI. A) Representative M-mode tracings from animals at baseline, 6 weeks post-MI+CBSC, 6 weeks post-MI+CDC, or 6 weeks post-MI+Saline. B) Structural and functional parameters derived from echocardiography measurements are shown. */**/***= CBSC v. Saline, */**/*** = CBSC v. CDC

