Fig 1.

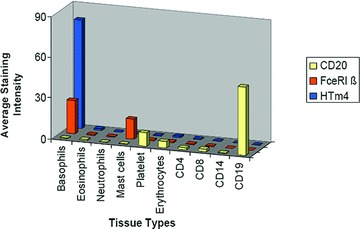
HTm4 expression in human normal peripheral blood cells by mRNA expression microarray profiling. X-axis indicates the cell types. Y-axis is the average intensity.

HTm4 expression in human normal peripheral blood cells by mRNA expression microarray profiling. X-axis indicates the cell types. Y-axis is the average intensity.