
Fig 7.
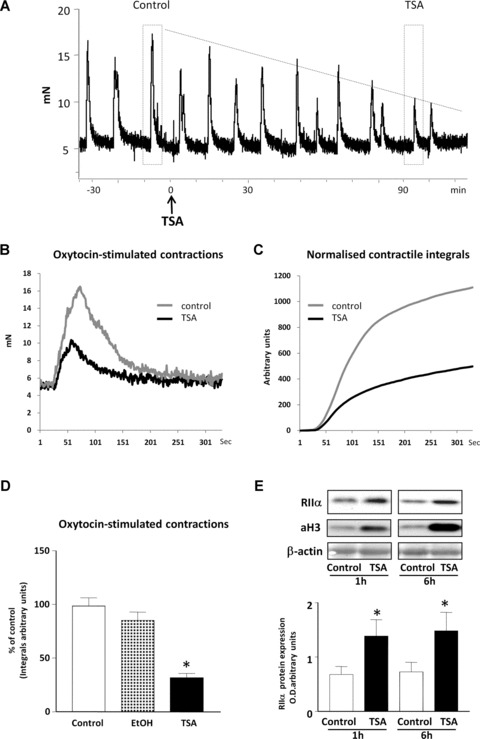
The effect of TSA on myometrial contractions. (A) Representative isometric tension recordings of oxytocin (10 μM) -induced contractions in human myometrial strips after TSA treatment (3.3 μM). Tension is represented in mN with time in minutes. Dashed boxes mark representative peaks of contraction for the myometrial tissue before treatment (control) and after 90 min. of TSA treatment (TSA). Comparison of the representative recordings and integrated area under the tension curve (integrals) for these peaks are presented in (B) and (C). (D) Effect of vehicle (EtOH) and TSA treatment on myometrial contractions measured as percentage of contraction of untreated control. Data are expressed as mean ± S.E.M. Results were obtained from three myometrial strips. *P < 0.05 Student’s t-test, TSA treated compared to untreated controls. (E) Effect of TSA treatment on expression of RIIα and acetylated Histone3 (aH3) levels in myometrial tissue strips treated for 1 and 6 hrs, respectively. Equal loading was confirmed using a β-actin antibody. Data are expressed as mean ± S.E.M. Results were obtained from three myometrial strips for 1 and 6 hrs, respectively. *P= 0.05 Student’s t-test, TSA treated compared to untreated control.