
Fig 3.
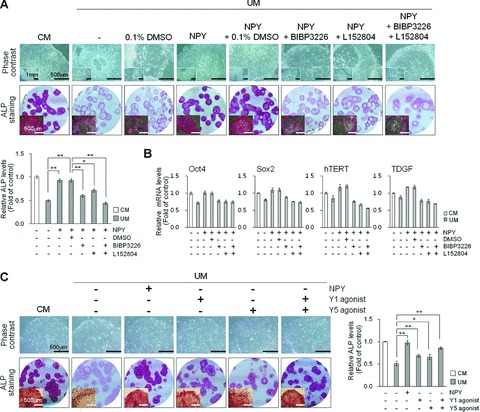
Effect of selective NPY Y1 and Y5 receptor antagonists and agonists on hESC cultures. (A and B) Effects of combined Y1 and Y5 antagonists on hESC cultures. H9 hESCs were cultured for 5 days under feeder-free conditions using CM or UM containing 0.5 mM NPY, 3 mM Y1 receptor antagonist (BIBP3226), or/and 3 μM Y5 receptor antagonist (L152804) in comparison with drug vehicle control (0.1% DMSO) or no treatment as indicated. Peptides and antagonists were added to fresh medium daily. Upper panels: representative phase contrast and ALP-stained images of H9 hESCs. Bar = 500 μm or 1 mm (inset images; upper row). Scanned images of 35 mm round culture dishes and macroscopic images were acquired after ALP staining. Bar = 500 mm (inset images; bottom row). Lower panels: relative ALP activity of the cell lysate measured at 405 nm. (B) Real-time qRT-PCR analysis for the expression of OCT4, SOX2, hTERT and TDGF. The results are displayed as the relative mRNA level with the level detected in undifferentiated hESCs cultured in MEF-CM set to 1 and are presented as the mean ± S.E. (n= 3). (C) Effects of combined Y1 and Y5 agonists on hESC cultures. H9 hESCs were cultured for 5 days under feeder-free conditions using CM or UM containing 0.5 μM NPY, 0.5 μM Y1 receptor agonist ([Leu31, Pro34]-NPY), or/and 0.5 μM Y5 receptor agonist ([cPP1–7, NPY19–23, Ala31, Aib32, Gln34]–hPP) in comparison with drug vehicle control (PBS) as indicated. Peptides and antagonists were added to fresh medium daily. Left panels: representative phase contrast and ALP-stained images of H9 hESCs. Bar = 500 μm (upper row). Scanned images of 35 mm round culture dishes and macroscopic images were acquired after ALP staining. Bar = 500 μm (inset images; bottom row). Right panels: relative ALP activity of the cell lysate measured at 405 nm. Relative ALP activity results are expressed as fold increase in ALP level as compared with that of MEF-CM. The data are presented as the mean ± S.E. (n= 3). **P < 0.01, *P < 0.05, by t-test.