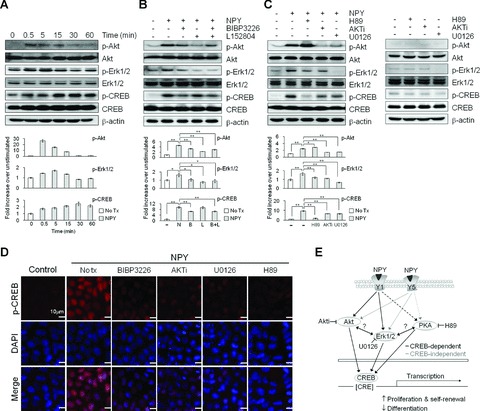
Fig 6.

Effect of NPY on intracellular signalling in hESCs. (A) Western blot of H9 cells treated with 1 μM NPY (N) for the indicated times. (B) Western blot of H9 cells treated with 1 μM NPY for 5 min. with or without a 1 hr pre-treatment with 3 μM BIBP3226 (B) or 3 μM L152804 (L). (C) Western blot of H9 cells treated with 1 μMNPY for 5 min. with or without a 1 hr pre-treatment with 10 μM AKTi, 10 μM U0126 or 10 μM H89 (upper panel), and kinase inhibitors only (lower panel). The membranes were probed with the indicated antibodies, and β-actin was used as a loading control. For protein quantification, the blots were scanned, and the bands were quantified using densitometry (A–C, lower panels). The data are presented as the mean ± S.E. (n= 3). **P < 0.01, *P < 0.05, by t-test. (D) Immunohistochemical analysis of hESCs treated with 1 μM NPY for 5 min. with or without a 1 hr pre-treatment with 3 μM BIBP3226, 10 μM AKTi, 10 μM U0126 or 10 μM H89. (E) Simplified schematic of possible intracellular signalling pathways activated by NPY and the Y1 and Y5 receptors in hESCs.
