3.

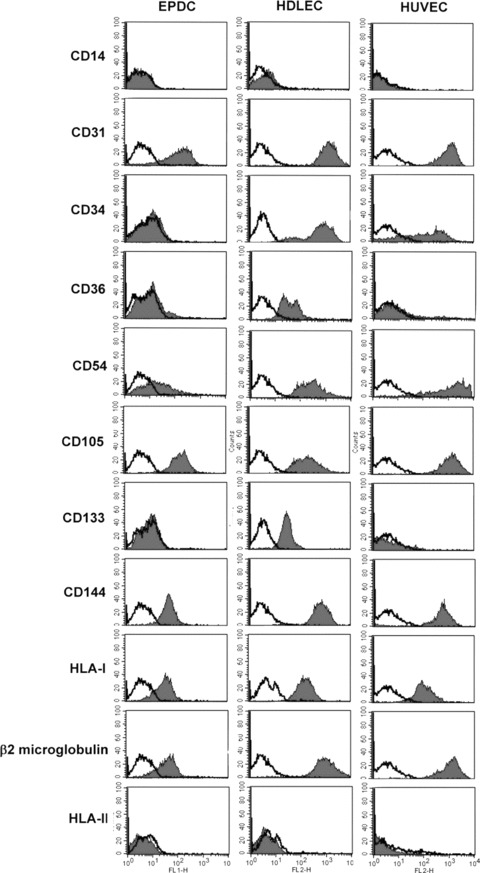
Comparative expression of surface markers in cultured EPC-derived cells, HDLEC and HUVEC by flow cytometric analysis. Cells were labelled with markers for EC, haematopoietic stem cells and monocytes. The black histograms outline the region of fluorescent intensity of the specific antibody and the white histograms that of the negative control antibody. These graphs are representative of five independent experiments.
