1.


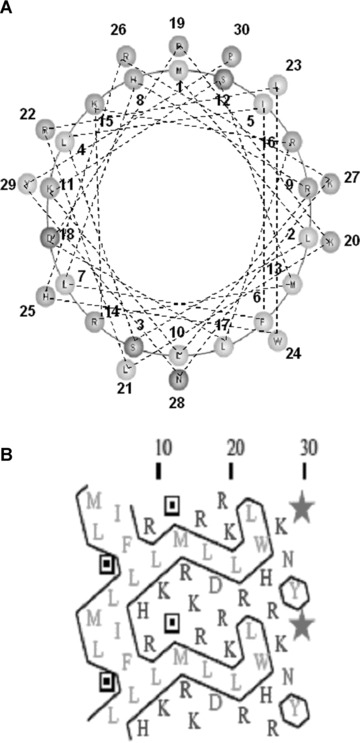
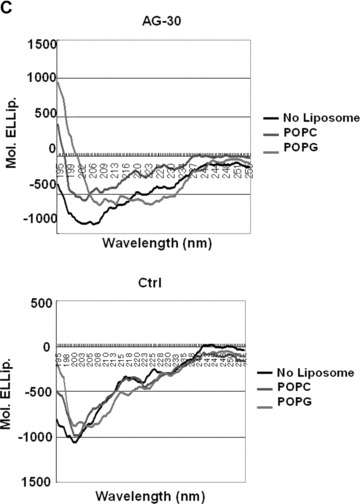
Conformation analysis of AG-30. (A) Schematic wheel plot of amino acid distribution of AG-30 in alpha-helical structure (http://www.nmr.cabm.rutgers.edu/bioinformatics/Proteomic_tools/Helical_wheel/). The hydrophobic amino acids are represented in gold, positive charged amino acids in green, negative charged amino acids in red-purple, proline in red and the other amino acids in blue-purple. (B) Protein sequence analysis on an alpha-helical 2D pattern using an HCA plot (http://bioserv.rpbs.jussieu.fr/RPBS/cgi-bin/Ressource.cgi?chznlg=fr&chzn_rsrc=HCA). The hydrophobic residues are represented in yellow-green and encircled, and different symbols used for P (*), and S (???). The positively charged amino acids are represented in purple, and the negatively charged amino acid (D) or other amino acids (N) are represented in red. (C) Secondary structure analysis of AG-30 and control peptide (Ctrl) by circular dichroism spectroscopy. CD spectra of AG-30 (50 μmol/L) and control peptide (50 μmol/L) without liposome (black line), with POPC (blue line) and with POPG (red line). Molar ellipticities, which indicates dimensions degrees decilitres mol–1 decimeter−1, were plotted against wavelength from 195 to 255 nm.
