
Figure 5.
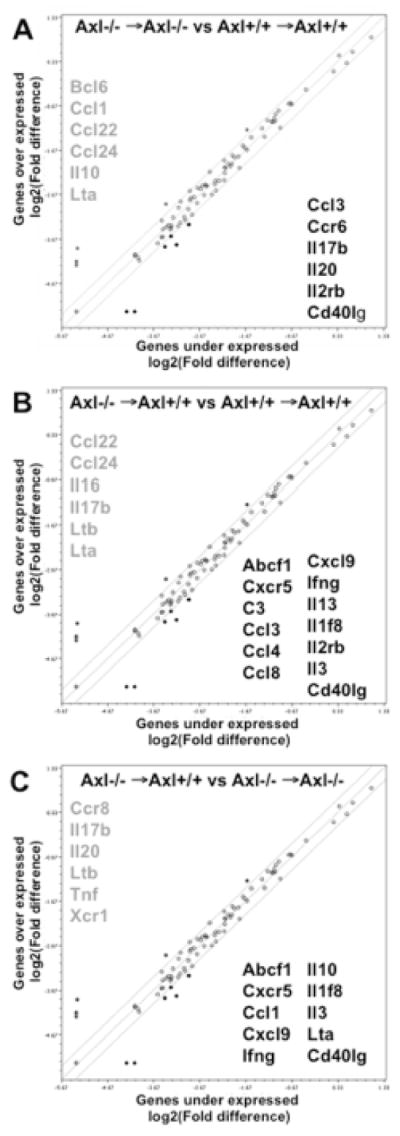
Cytokine and chemokine gene profiling in the kidneys from Axl chimeras 1week after DOCA-salt. A. Changes in Axl−/− →Axl−/− compared to Axl+/+ →Axl+/+ chimeras. B. Axl−/− →Axl+/+ compared to Axl+/+ →Axl+/+. C. Axl−/− →Axl+/+ compared to Axl−/− →Axl−/−. Individual genes are represented as dots on the scattered plot. The thinner lines show 2-fold cut offs. Up-regulated genes are listed in gray color, down-regulated – in black color.