2.

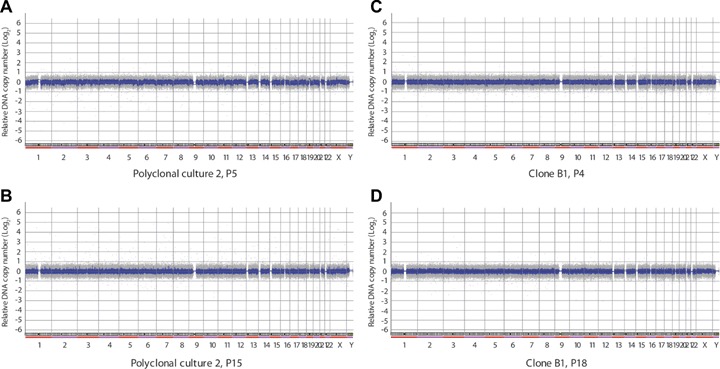
Array CGH profile of polyclonal and clonal cultures of adipose stem cells. (A, B) Polyclonal culture Pc2 at P5 (A) and P20 (B). (C, D) ASC clone B1 at (C) P4 and (D) P18. For a chromosome by chromosome analysis, see Supplementary Table 1, ID 94334, 94138, 94131 and 100285, respectively. Normalized log2 ratio for each oligonu-cleotide is plotted in grey and a moving average of 9 clones in blue.
