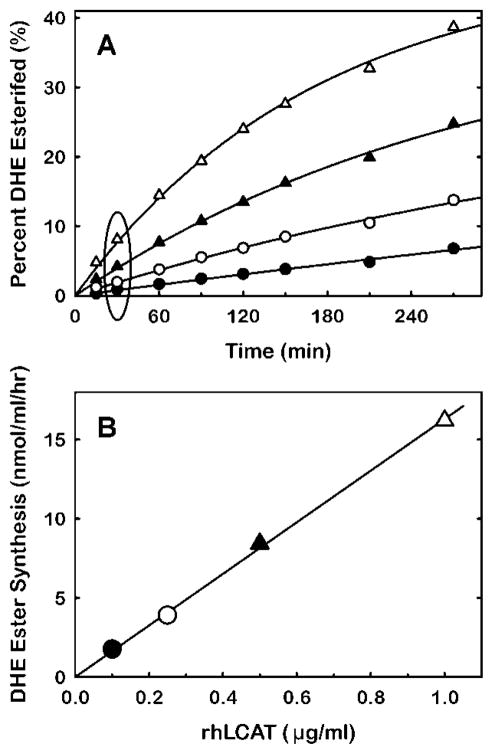
Figure 4.
Time-course of dehydroergosteryl ester synthesis as a function of rhLCAT concentration. (A) Volumes of HDL-mimetic substrate of the composition described in Fig. 2 were incubated with rhLCAT at concentrations of 0.1 μg/ml (●), 0.25 μg/ml (○), 0.5 μg/ml ((▲) and 1 μg/ml (△). At the times indicated, two 100 μL aliquots were removed from each sample for fluorescence quantitation of dehydroergosteryl ester (Materials and Methods). (B) The data for amount of dehydroergosteryl ester formed at 30 minutes incubation (circumscribed by the ellipse (A)) are plotted as a function of rhLCAT concentration. The line indicates the linear regression fit. The slope, which corresponds to the specific activity of rhLCAT, is 16 nmol/μg/hr.

