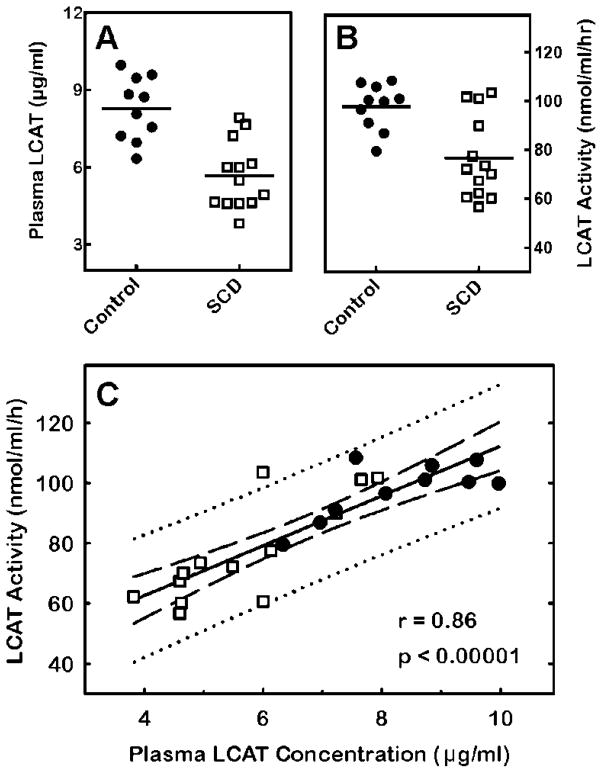
Figure 7.
Detection of differences in plasma LCAT activity and mass between control subjects and sickle cell disease (SCD) patients. (A) LCAT concentration, determined by ELISA, is significantly lower in plasma from SCD patients (□) relative to control subjects (●) (p < 0.0001). The solid lines indicate the means. (B) LCAT activity is significantly lower in plasma from SCD patients relative to control subjects (p = 0.002). Activity was determined as described in Materials and Methods. (C) Correlation between plasma LCAT activity and concentration. The LCAT activity in each plasma sample is plotted against the corresponding LCAT concentration. The best fit of the data to a line was determined by linear regression (solid line). The 95% confidence interval (dashed lines) and prediction interval (dotted lines) is also shown. The Pearson correlation coefficient (r) p-value are shown.

