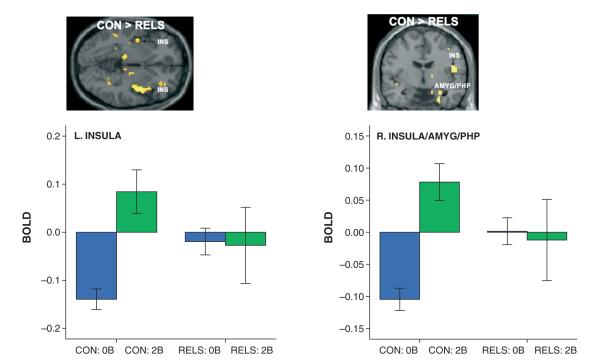
Fig. 3.
SPM(t) maps showing greater activation of left insula (INS) and right INS (BA 13), amygdala (AMYG), and parahippocampus (PHP) from 0-back to 2-back condition in controls (CON) compared to first-degree relatives of persons with bipolar disorder (RELS), after controlling for Profile of Mood States vigor scores (2-back working memory > 0-back task contrast; MNI coordinates of peak voxel: left INS: x = −36, y = −18, z = 6; right INS/AMYG/PHP: x = 36, y = −15, z = −24). Graph depicts parameter estimates [mean blood-oxygen-dependent (BOLD) fMRI signal change, with standard error bars] extracted from the left INS cluster (left graph) and a right cluster which included the INS, AMYG, and PHP (right graph) for the 0-back (0B) and 2-back (2B) conditions relative to fixation (represented by the zero baseline) for each group.

