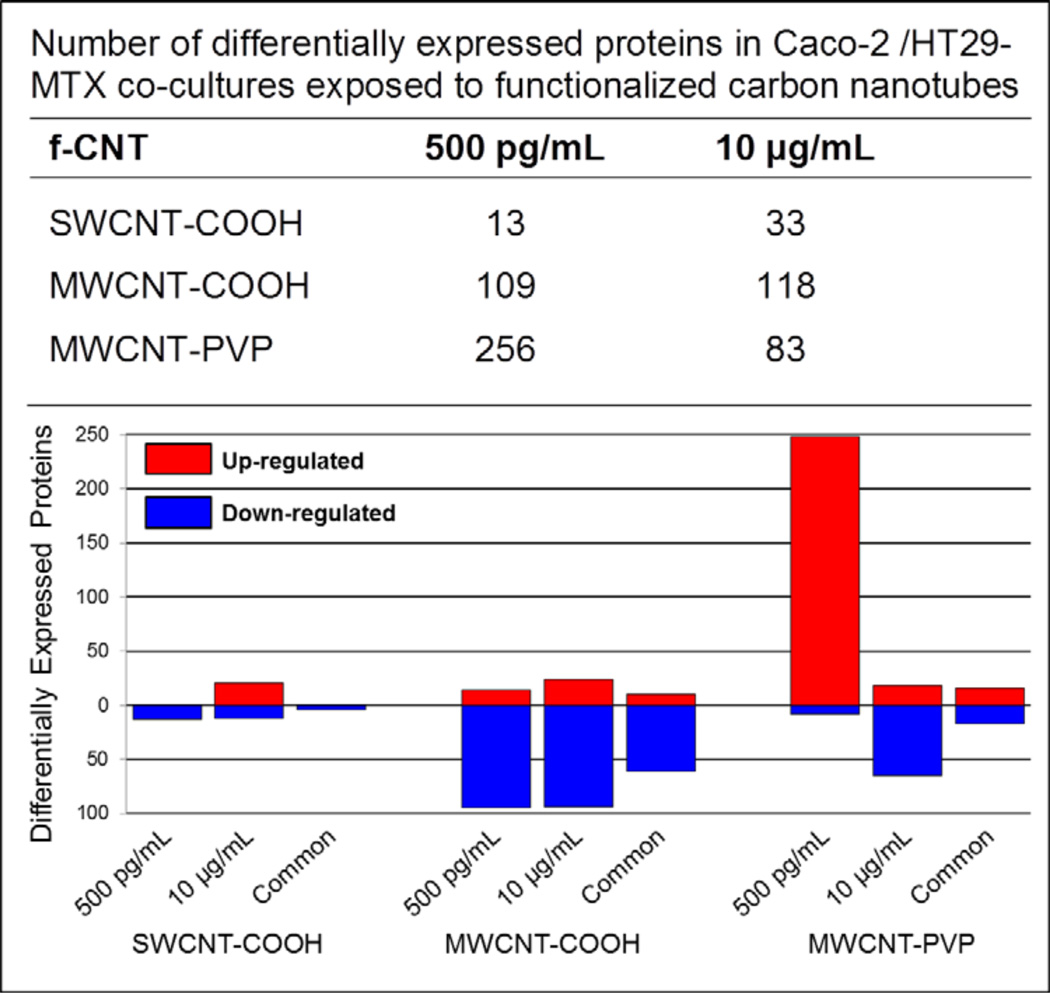
Figure 7.
Effect of f-CNT exposure on protein expression in Caco-2/HT29-MTX co-cultures (see online version for colours)
Notes: The top portion of the figure lists the number of proteins differentially expressed (ANOVA p < 0.01, p < 0.05 after Holm-Sidak multiple comparisons) by each exposure and nanoparticle from a total of 2,282 cellular proteins identified and quantified. These data are expanded in the graph, which illustrates the comparative extent of up- and down-regulation of the altered proteins. Overall, a significantly smaller number of proteins were affected by SWCNT-COOH exposure than either of the f-MWCNTs. Down-regulation of protein expression dominated most f-CNT exposures, though low-dose MWCNT-PVP exposure uniquely up-regulated 97% of the altered proteins, and it had the greatest effect of all f-CNTs on differential expression (Δ 256 proteins).

