
Figure 2.
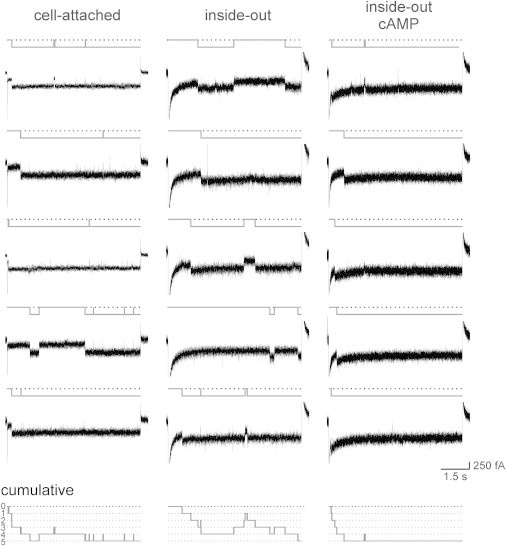
Single-channel recordings of HCN2 channels in patches containing one channel at three conditions. The test voltage was −130 mV. The traces in the cell-attached configuration were obtained from two patches, whereas those in the inside-out and inside-out plus cAMP configurations were obtained from one patch. The idealized traces are shown in gray. The closed state is indicated by the black dotted line. The time courses of the cumulative idealized traces (bottom row), obtained as the sum of the respective idealized traces above, correspond to the respective time courses in Fig. 1, A and B.