
Figure 3.
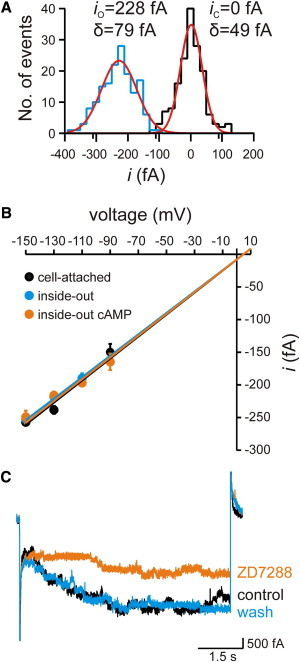
Single-channel conductance and block of HCN2 channels. (A) Local amplitude histogram for a single-channel opening in an inside-out patch at −130 mV. The histogram was obtained from 160 sampling points immediately before opening (closed state, black) as well as after opening (open state, blue). The histograms were fitted with two independent Gaussian functions (red). The fit parameters for the means, ix, and widths, σx, are io = −228 ± 1 fA, σo = 79 ± 2 fA, ic = 0 ± 1 fA, and σc = 49 ± 1 fA. (B) Single-channel conductance. The conductance was determined for the three indicated conditions by a linear fit of the respective data points. The single-channel conductance was 1.69 ± 0.12 pS in the cell-attached configuration, 1.64 ± 0.13 pS in the inside-out configuration, and 1.67 ± 0.14 pS in the inside-out configuration with cAMP. The reversal potential of 4.6 mV was set according to the Nernst equation by inserting K+ concentrations at both sides of the membrane (see text). (C) HCN2 channel activity was reversibly blocked by 50 μM ZD7288 in a multichannel patch at −130 mV.