
Figure 6.
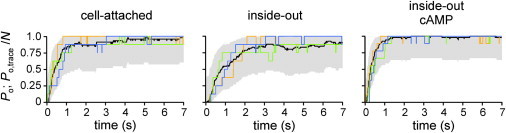
Comparison of the time course of activation at −130 mV between channels operating in patches containing only one channel and channels operating in multichannel patches. Plotted are Po(t) obtained from single-channel patches (black curves) and normalized idealized graphs from multichannel patches (colored curves). For each condition, three representative multichannel traces are shown. The 95% confidence intervals along Po(t) are shown in gray. For further explanation, see text.