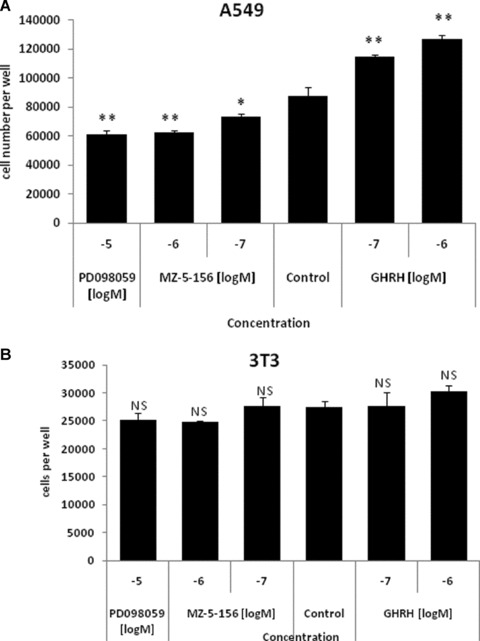
fig 3.

(A) Proliferation rate of the A549 cells exposed to 0.1 μM and 1 μM GHRH (1–29)NH2 and MZ-5–156 as well as 10 μM MAPK inhibitor. *P < 0.01 versus control cells **P < 0.001 versus control cells. NS: non-significant. (B) Proliferation rate of the 3T3 cells exposed to 0.1 μM and 1 μM GHRH (1–29)NH2 and MZ-5–156 as well as 10 μM MAPK inhibitor. NS: non–significant.
