
fig 6.
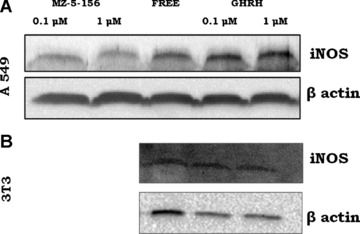
(A) Expression of iNOS by A549 cells after exposure to 0.1 μM or 1 μM GHRH (1–29)NH2 and 0.1 μM GHRH antagonist MZ-5–156. Protein levels were normalized to β actin signal (loading control). The blot is representative of two independent experiments (B) Expression of iNOS by 3T3 cells after exposure to 0.1 μM or 1 μM GHRH (1–29)NH2. Protein levels were normalized to β actin signal (loading control). The blot is representative of two independent experiments,