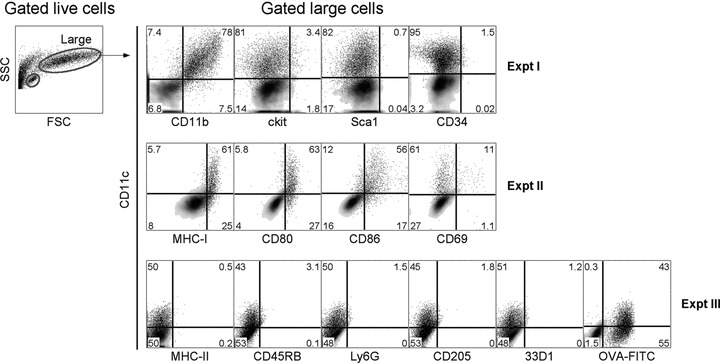
fig 1.

Phenotype of LTC-DC. Non-adherent cells were collected from LTC, stained with antibody (or isotype controls) and PI (1 μg/ml), and analysed flow cytometrically to identify live (PI−) cells. FSC and side scatter (SSC) analysis revealed a clear population of large LTC-DC for analysis of marker expression. To measure endocytic capacity, cells were incubated with 2 mg/ml FITC-OVA for 45 min. at 37°C (or 4°C as control). Density plots reveal background staining with isotype controls (or endocytosis control) used to set gates. Percentage positively staining cells (shown as dot plots) is indicated in quadrants.
