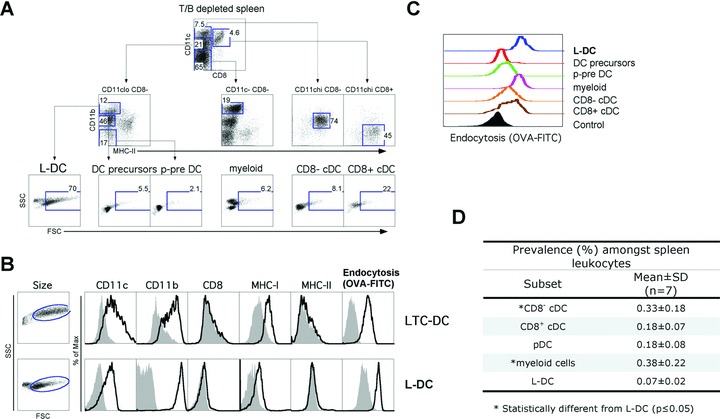
fig 4.

Isolation of a spleen in vivo equivalent of LTC-DC (L-DC). Dissociated, RBC-lysed and T cell depleted spleen cells were stained with specific antibodies and PI (1 μg/ml) prior to flow cytometric analysis. Endocytic capacity was measured in vitro by uptake of FITC-OVA as described in the Figure 1 legend. (A) Live (PI−) cells were gated. Subsets of interest were identified after setting gates to delineate cells on the basis of internal negative and positive cell populations. Forward scatter (FSC) and side scatter (SSC) are shown for each gated population to compare size distribution. Numbers represent percentage cells within gates. Data are representative of a highly consistent pattern of subset distribution across many mice of several strains and age >4 weeks. (B) Phenotypic comparison of size (FSC), marker expression and endocytic capacity was made between LTC-DC and L-DC. Shaded histograms indicate isotype control binding (or endocytosis control). (C) In vitro capacity for endocytosis of OVA-FITC was assessed for each gated spleen subset in relation to a non-endocytic control cell population (filled histogram). (D) The prevalence of each of the defined cell subsets was measured in terms of percentage among total spleen leucocytes.
