
Figure 8.
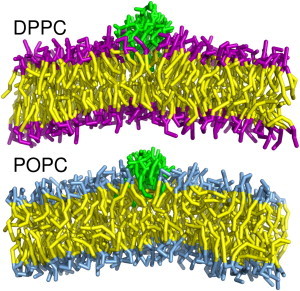
Sample images of curvature induced by nine fengycin clusters in both DPPC and POPC bilayers. (Fengycins are green, lipid tails are yellow, and headgroups for DPPC and POPC are purple and blue, respectively.)
Official websites use .gov
A
.gov website belongs to an official
government organization in the United States.
Secure .gov websites use HTTPS
A lock (
) or https:// means you've safely
connected to the .gov website. Share sensitive
information only on official, secure websites.
Sample images of curvature induced by nine fengycin clusters in both DPPC and POPC bilayers. (Fengycins are green, lipid tails are yellow, and headgroups for DPPC and POPC are purple and blue, respectively.)