Fig. 4.

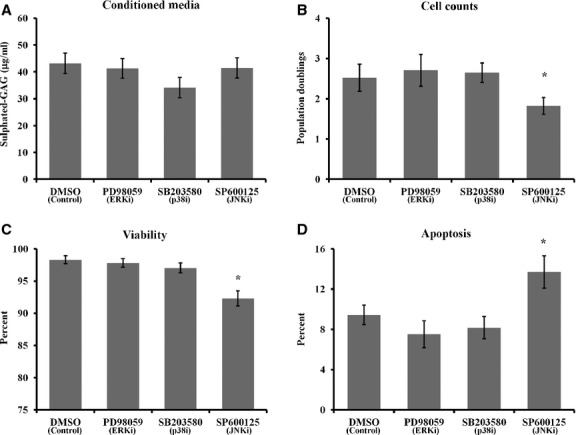
Effects of MAPK inhibition on GAG secretion, proliferation and viability after day 7. (A) Conditioned media was collected from treated cultures after day 7 and subjected to DMMB assay to quantify sulfated GAG secretion into the media. (B) Population doublings calculated after day 7. (C) LIVE/DEAD assay was used to quantify viability. (D) Immunofluorescence microscopy was used to visualize cleaved caspase-3, an indicator of apoptosis, and positive cells were quantified. Mean ± SEM (n = 3). * indicates P < 0.05, Student's t-test.
