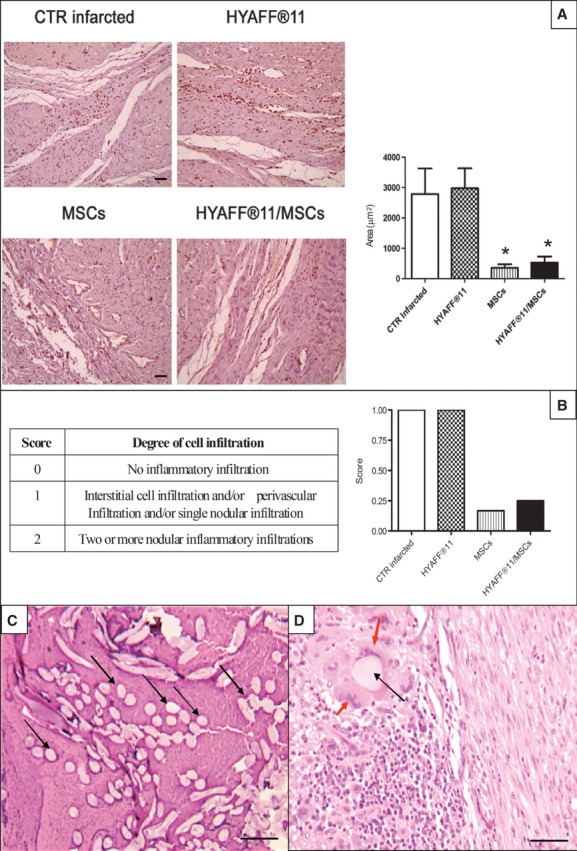
Fig. 7.

Inflammatory reaction and related score of the infarct area. (a) The micrographs show the inflammation process expressed as area stained with CD3-positive inflammatory cells (lymphocytes), whereas the bar graph shows the statistical difference among groups. The transplantation of MSCs, with or without HYAFF®11, almost completely reduced the density of cellular infiltrate. Scale bars: 100 μm. *P < 0.05 versus both Ctr infarcted and HYAFF®11 groups. (b) The quantification of the inflammatory reaction was confirmed by attributing a score from 0 to 2, according to the degree of cell infiltration (table inside). (c and d) A foreign body reaction was clearly activated close to the fibres of HYAFF®11 (black arrows) 4 weeks after transplantation. Scale bars: (c) 100 μm; (d) 50 μm. Macrophages and giant cells were found only around the fibres of the scaffold (red arrows). Ctr infarcted, n = 5; HYAFF®11, n = 3; MSCs, n = 3; HYAFF®11/MSCs, n = 4.
