
Figure 3.
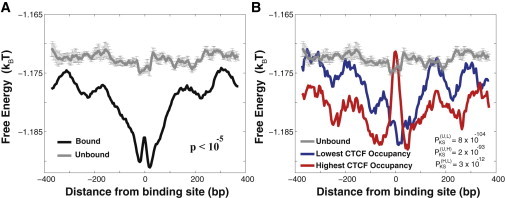
Specific, functional binding sites of human transcription regulator CTCF, are surrounded by the genomic DNA background with statistically modulated nonconsensus protein-DNA binding free energy. The genomewide ChIP-exo measurements of CTCF binding are taken from Rhee and Pugh (1). (A) The computed average free energy per bp, 〈f〉, in the interval (−400,400) around specific, experimentally bound CTCF motifs genomewide, as compared with the corresponding 〈f〉 computed around the control set of unbound motifs. In our calculations we used 5000 model TFs, M = 8 and L = 50. See Materials and Methods for the description of the control set of unbound motifs and for the calculation of the p value. To compute the error bars, we randomly divided the control set of sequences into five subclusters, and computed 〈f〉 in each subcluster. The error bars are defined as one standard deviation of 〈f〉 between subclusters. (B) The average free energy per bp, 〈f〉, for the 10% highest CTCF occupancy and the 10% lowest CTCF occupancy subgroups of sequences. The Kolmogorov-Smirnov p values are computed within the interval (−50,50). The notation, PKS(U,L), defines the Kolmogorov-Smirnov p value between the free energy distributions of the subgroup of unbound sequences and the subgroup of sequences with the lowest CTCF occupancy, respectively. The additional Kolmogorov-Smirnov p values are defined analogously. To see this figure in color, go online.