Fig 1.

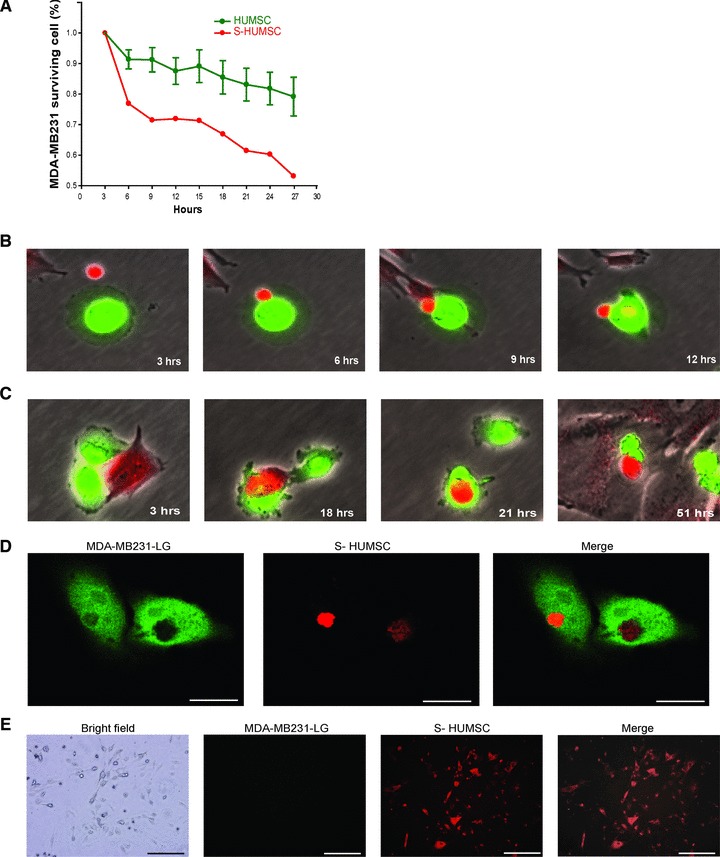
Effect and mechanism of selected HUMSC to suppress MDA-MB231. (A) Using Cellomics ArrayScan, the number of MDA-MB231 decreased slightly in five of the six co-cultured wells (HUMSC), whereas in one of the six wells (S-HUMSC), the number of MDA-MB231 dramatically decreased. The somehow more ‘active’ HUMSCs with better ability to suppress tumourigenesis were selected for further experiments. Data of HUMSC are means ± SEM (n = 5). (B) Fluoroscopic images from time-lapse analysis after co-culture showed the selected HUMSC (red) and MDA-MB231 (green) adhered on contact, and then the HUMSC infused some of its substance into MDA-MB231. (C) Fluoroscopic images from time-lapse analysis after co-culture showed the selected HUMSC (red) contacted with MDA-MB231 (green) and then internalized into MDA-MB231 to form a cell-in-cell structure. The MDA-MB231 shrank following their subsequent separation. (D) On confocal microscopy, simultaneous presentation of MDA-MB231 (green) and HUMSC (red) at the same site at a plane manifested the cell-in-cell structure of selected HUMSC internalized within MDA-MB231. Scale bars: 15 μm. (E) After co-culture of MDA-MB231 (green) with selected HUMSC (red), cells with dual fluorescence (red + green) were isolated and cultured for three more days. Only the red fluorescence was still visible on fluoroscopy. Scale bars: 100 μm.
