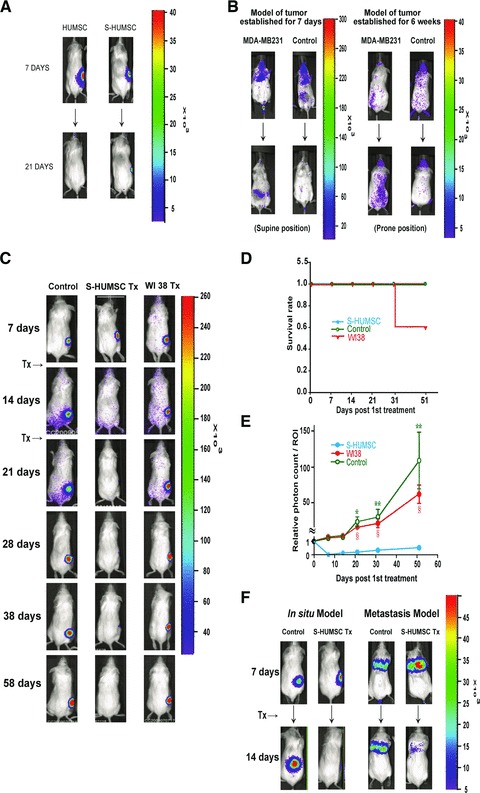
Fig 4.

Suppression of breast cancer tumourigenesis by selected HUMSCs in animal models. (A) In vivo bioluminescence imaging seven days post-injection showed persistence of both ‘inactive’ HUMSCs (n = 5) and selected ‘active’ HUMSCs (n = 5) locally at the site of injection. However, no more bioluminescence signals of ‘inactive’ HUMSCs were visible (n = 5) 21 days post-injection whereas bioluminescence signals of selected ‘active’ HUMSCs were decreased but still visible (n = 5) on the same day. (B) In vivo bioluminescence images of tumour-bearing mice showed localization of selected HUMSCs in the fat pad where MDA-MB231 cells were injected in both the models of tumour established for seven days (n = 5) and for six weeks (n = 5), while the signals of HUMSCs almost disappeared in normal control mice (n = 5) of both models. (C) In local HUMSC treatment group (n = 5), bioluminescence signals of MDA-MB231 were completely invisible from seven days to 51 days post first HUMSC injection, but the signals kept increasing through the same period in breast cancer control group (n = 5) and WI38 treatment group (n = 5). (D) Survival rate of NOD/SCID mice. (E) Relative photon count level obtained at the end of the experiment was 0.27 in local HUMSC treatment group, 112.67 in breast cancer control group and 65.77 in WI38 treatment group. Data are means ± SEM. *P < 0.05, **P < 0.01 comparing HUMSC treatment with cancer control. §P < 0.05 comparing HUMSC treatment with WI38. (F) In systemic HUMSC treatment group, bioluminescence signals of MDA-MB231 were completely invisible in in situ model (n = 5) and nearly invisible in metastasis model (n = 5) seven days post-HUMSC injection, but the signals were increased in breast cancer control group (n = 5) of both models.
